

The first version of ezmsg was much smaller than the thing it became.
I wanted to send a sequence of text messages for a study. A message at enrollment, another one later, a question in the middle, and a different follow-up depending on the answer. The first prototype could do that. It was enough to prove the idea and nowhere near enough to trust with a real participant.
The questions arrived quickly:
What happens when someone answers before a scheduled reminder is sent? What happens when a worker stops halfway through a delivery? What happens when an author changes a protocol that people are already following? And what does the participant see when their phone loses its connection for an hour?
Those questions changed the project. I stopped thinking about it as a messaging API and started thinking about it as a system for running conversations.
Today the project has three parts:
ezmsgis the backend and protocol runtime.ezmsg-uiis the web console, branded as Dash Messaging.ezmappis the participant-facing mobile app.
The product is built around a simple idea: a conversation should be designed once, then run consistently for every participant while remaining easy to inspect, simulate, and change.
The stack follows those constraints. The backend is Python with FastAPI, Postgres, Redis, and background workers. The console is Next.js, React, and TypeScript, with React Flow for the graph editor and a generated OpenAPI client for the backend contract. The mobile app is Flutter and Dart, backed by SQLite for local conversation state. Prometheus, Grafana, Loki, OpenTelemetry, and Jaeger make up the monitoring layer.
I chose those pieces for different failure modes: Postgres holds durable conversation state, Redis moves retryable work, SQLite keeps a participant's local view available, and the monitoring stack lets me follow one message across all of them.
If you want to see the result before reading about it, open the Dash Messaging console.
The video shows the surface of the product. The diagram below is the shape I keep in my head when I am tracing a message through the system.
I started with a graph, not a message queue
Most chat systems begin with a message: someone writes, the server delivers, someone replies.
ezmsg begins earlier. Someone designs the conversation.
A protocol describes the messages, questions, timing, branches, and participant state that make up a study. One step might send an introduction. Another might ask a poll question. The answer can determine which conversation comes next. A reminder might happen two days later, unless the participant already completed the step. A keyword can enroll someone or trigger a particular part of the flow.
The central model is a graph. The graph gives the conversation shape, while the runtime supplies the current participant state. “This answer leads to one of these two follow-ups” is represented as data, so the relationship stays visible in the protocol.
In Dash Messaging, an author can see the branches, connect nodes, attach timing, add conditions, and run the result. The editor is editing the protocol itself, so the graph and the executable definition stay together.
I made one choice early that has held up well: authoring and execution are related, but separate. The authoring side is concerned with whether a protocol is understandable and valid. The runtime is concerned with whether a message is allowed to happen for this participant, at this moment. Keeping those concerns apart made the system easier to evolve.
There are two representations of that model. Inside Postgres, relationships use stable database IDs because the authoring API needs relational integrity and efficient updates. The portable representation uses names because a person reviewing a JSON file should be able to understand what one node points to without looking up a UUID. It is a small amount of deliberate duplication, but it keeps the database model and the interchange format good at different jobs.
The runtime model separates graph topology from timing semantics. An edge says which node can follow another. The timing rule says whether that child runs after a completed node, after a participant answers a particular message, or after a date stored in participant state. With that split, one graph can express both “go to the next question” and “send this reminder two days later.”
A poll shows the full loop. The runtime sends the poll, records an open poll, stores the participant's reply in the target state, and evaluates the answered children using the new value. Keywords are checked first, then the runtime falls back to poll or signal handling. If a node is terminal, the runtime closes the flow and clears pending work so old reminders do not remain active.
The code follows the same shape as the model. ProtocolRuntimeService coordinates separate outbound and inbound flow services and gives both the same runtime port for persistence and protocol reads. The SQLAlchemy adapter sits behind that port. HTTP routes, enrollment, and workers can therefore call the same runtime semantics without each reimplementing timing, channel resolution, or graph advancement. It also makes the hard cases testable: the runtime can be exercised with a fake port, while the real provider and Redis stay out of a condition or idempotency test.
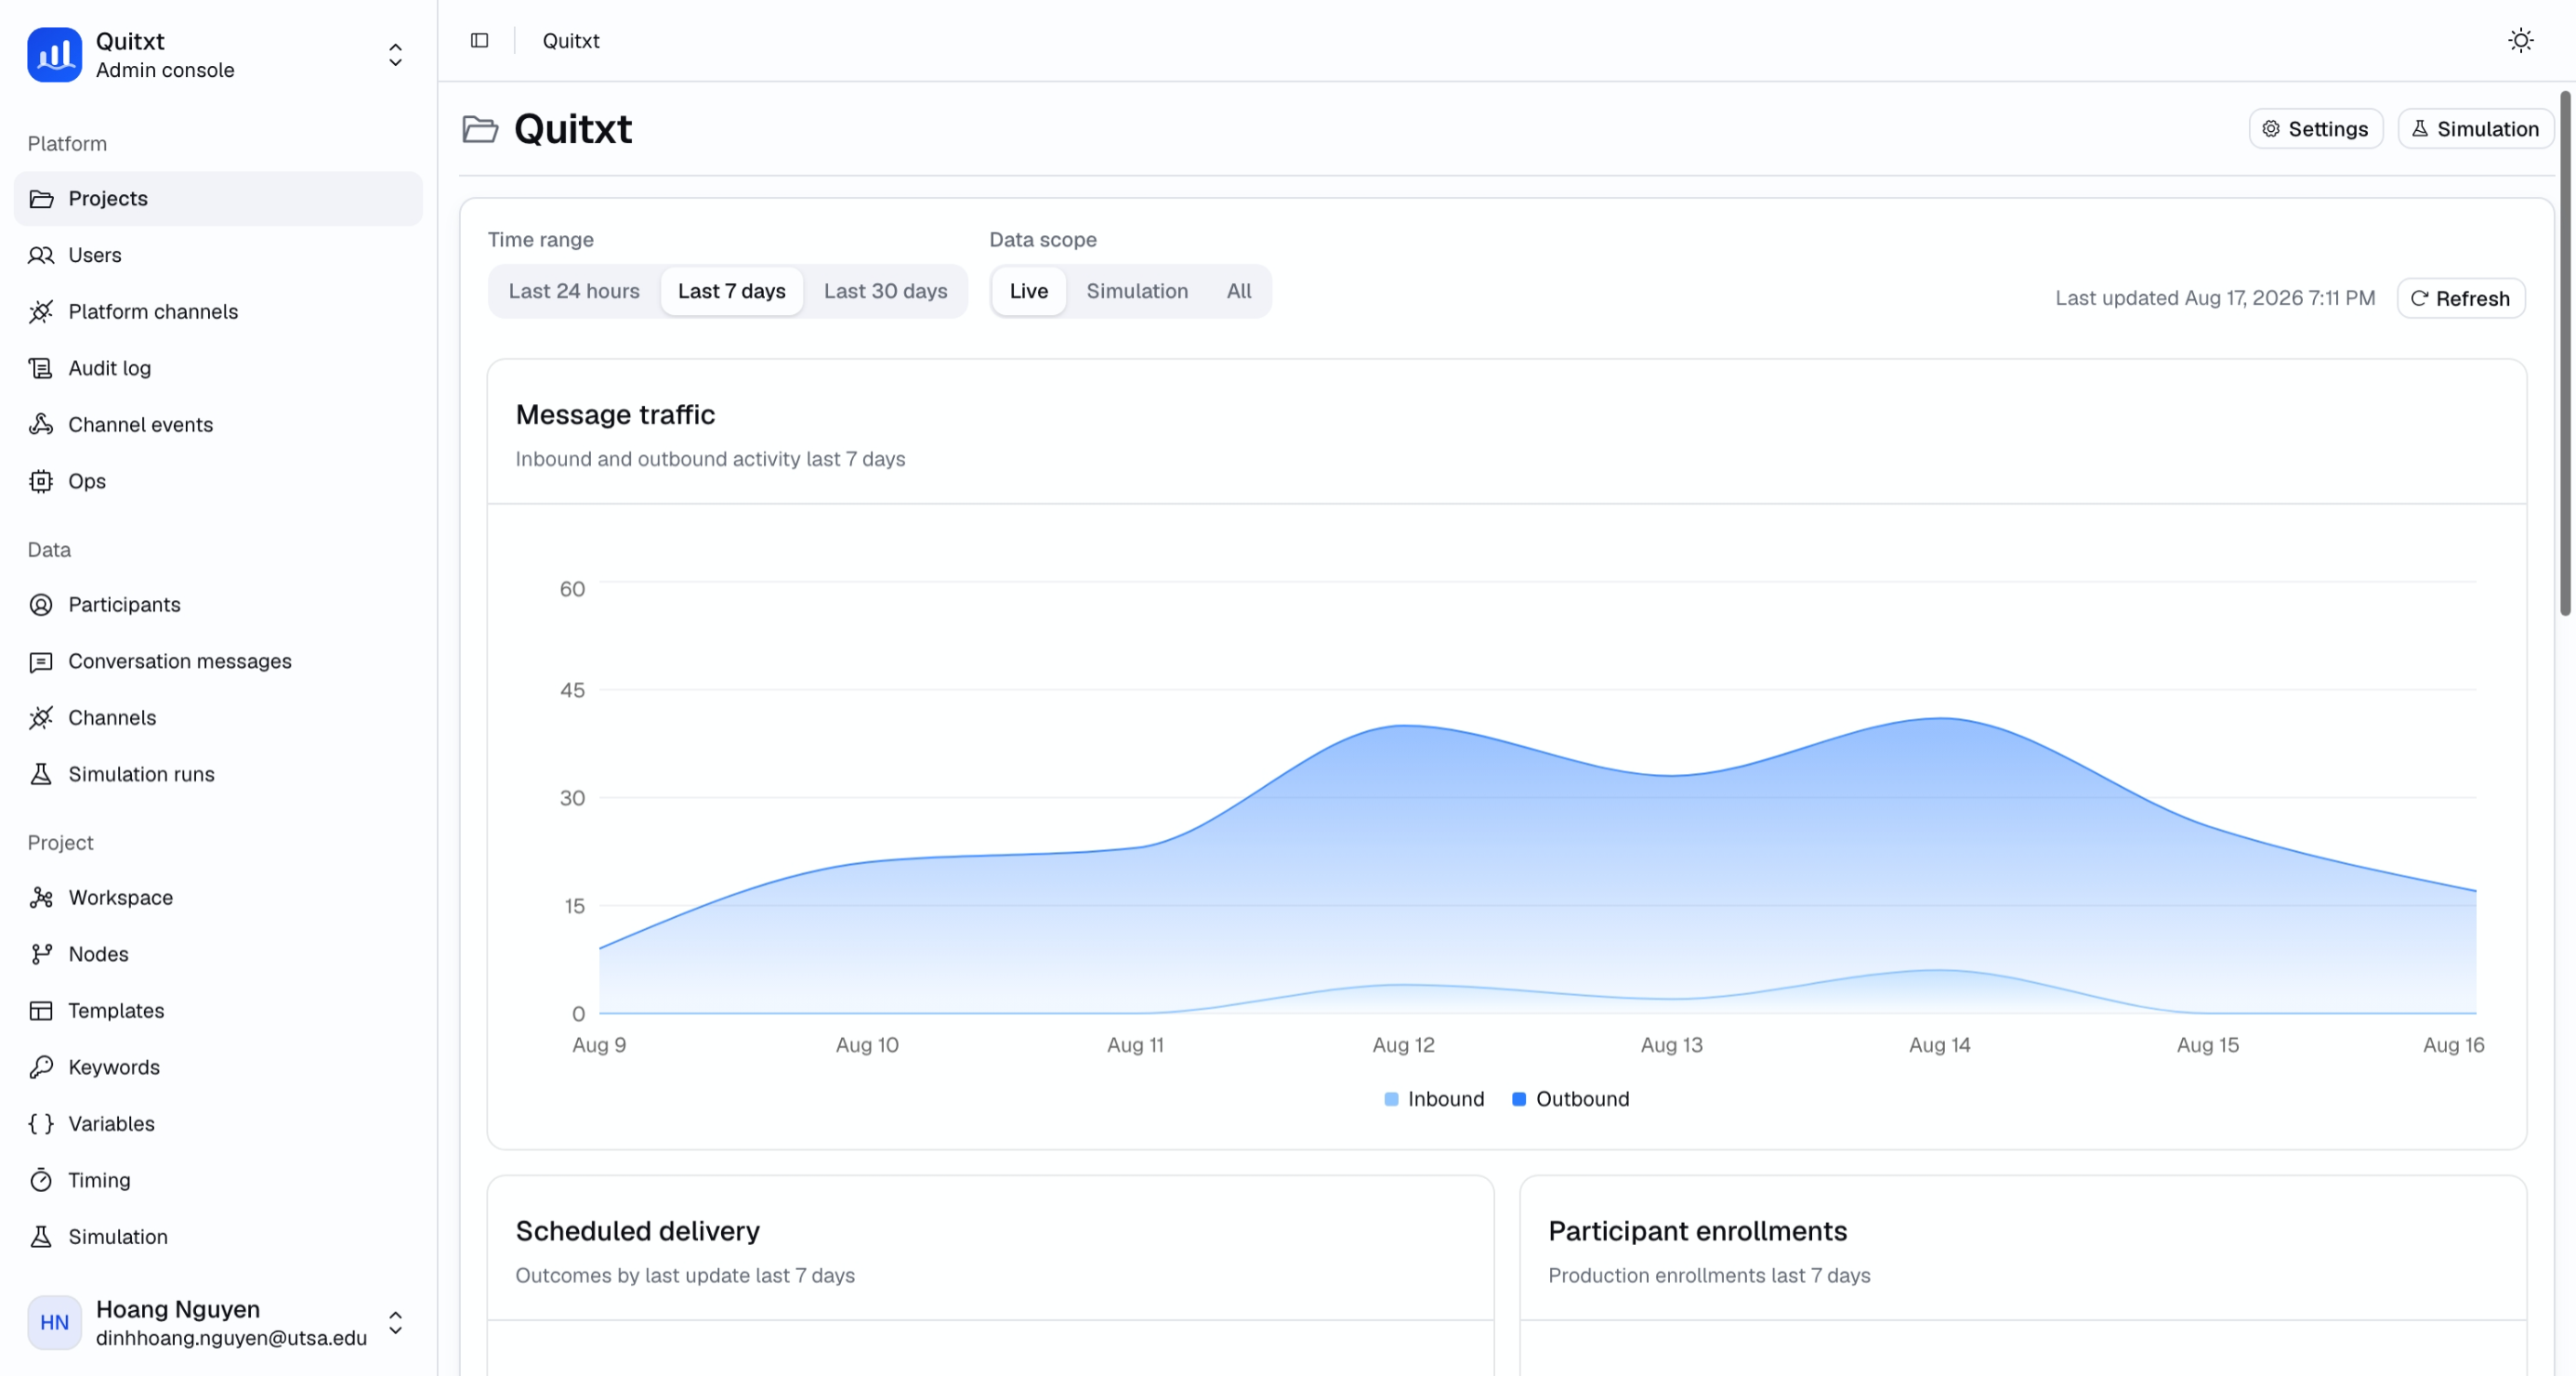
Dash Messaging turns a running protocol into something an operator can see and understand.
A JSON bundle made the protocol portable
The graph editor is the best place to design a protocol, but it should not be the only place where a protocol exists.
I wanted a study to be exportable as a readable JSON file. That file can be reviewed, stored with a project, used as a repeatable test fixture, or moved into another environment. It also gives the protocol a life outside the web UI. If the interface disappeared tomorrow, the conversation would still have a portable definition.
The bundle is a versioned contract built for export, review, and import. The current format is a schema_version: "2.0" document containing the protocol's named conditions, templates, timing, nodes, edges, variables, and keywords. Export can also wrap that document in an envelope with project metadata and a checksum. That makes it possible to compare two protocol exports and verify that an import really round-tripped the same definition.
The backend treats import as a validation workflow. It checks the JSON structure, verifies that references point to real parts of the protocol, and validates relationships such as localized poll answers and timing dependencies. The import starts as a dry run, so an author can see whether a bundle is safe before changing a project.
The import runs as a background job. It reports progress and replaces the protocol in one transaction only after validation succeeds. A project with active participants or scheduled work is not silently overwritten. Transient database failures can be retried, and a failed replacement rolls back without leaving a partial protocol behind.
Submitting the same operation key returns the existing job. The worker claims only one bundle job for a project at a time, so two replacements cannot race each other. That makes the import safe to use in a deployment or a test pipeline.
The bundle worker also distinguishes authoring failures from infrastructure failures. A malformed or unsafe bundle becomes a terminal failed job with a useful phase and error detail. A database connection failure can move the job to retry_pending, where the worker can try the complete operation again. The claim loop excludes a project after taking one job in a batch, so two imports for the same project cannot be processed concurrently just because they were both waiting in the queue.
I use bundles to seed projects, move a protocol between environments, test the runtime against a known conversation, and keep the authoring model honest. The exported file is also a much better artifact for a review than a screenshot of a graph.
The backend: make the conversation dependable
The backend has two different kinds of work.
Some work needs a direct answer. Creating a protocol, enrolling a participant, changing a project, or opening the console should feel like a normal API request. Other work should happen in the background: waiting for timing, sending a message, processing a provider reply, updating a simulation, or retrying something that temporarily failed.
FastAPI handles the request side. Postgres stores the durable state. Redis moves background work to workers that can process it independently of the web processes.
Postgres records what has happened. Redis carries a request to do the next piece of work. If a worker disappears, the database remains the recovery source for that work.
I split the HTTP surface into three APIs before the system became large enough to force the decision. The Admin API owns platform and governance work. The User API owns project-scoped authoring, runtime controls, and simulation. The Participant API owns enrollment, participant authentication, device registration, and the mobile-facing conversation. They share application services and infrastructure, but they do not share an authentication boundary by accident.
The split keeps authorization explicit. A platform administrator does not automatically bypass project membership when using the User API, and a participant bearer token is never treated as a staff role. Platform authorization, project membership, and participant identity are checked at different boundaries.
That division changed how I handle failure. A queue message is temporary; enrollment, scheduled messages, and delivery receipts are durable records. If Redis is unavailable, the database still shows that the handoff has not happened. If infrastructure delivers the same event twice, the runtime can recognize it without advancing the conversation twice.
I also kept production and simulation separate. Simulation uses the same protocol rules, but it has its own clock and its own delivery path. An author can move time forward, answer a simulated question, and inspect the result without sending anything to a real phone. That sounds obvious now. It was not something I wanted to discover after the first accidental production send.
The outbound path has a small number of explicit stages. The runtime decides that a message should exist. A scheduler finds it when it is due. A worker picks it up and hands it to a channel provider. The result is written back to the database. The next part of the graph is evaluated from the new state.
The handoff from Postgres to Redis is protected by an outbox. The scheduler records a durable wake-up row in the same database that stores the scheduled message. A publisher claims unpublished rows, writes a typed event to Redis, and marks the row published only after Redis accepts it. If Redis is unavailable, the database still knows that the handoff has not happened yet.
The order matters. The publisher takes a row-locked batch, builds an OutboundRequestEventV1, chooses the production or simulation stream from the scheduled-message context, calls Redis XADD, and only then writes published_at. If XADD fails, the outbox row keeps its error state and remains available for another attempt. The handoff is at-least-once, and idempotent consumers make repeated entries safe.
Redis Streams and consumer groups let a worker reclaim an entry left idle after a crash. Production and simulation use separate work paths, so a virtual-clock run cannot enter the production channel. Each handoff can be retried, inspected, or recovered without reconstructing it from logs.
The runtime checks the current participant and protocol state again before dispatching a scheduled row. If a participant answered a poll after a reminder was scheduled, the reminder can be skipped. If a worker retries completion, the runtime records that the graph has already advanced and does not create the next branch twice. A request header carries intent; the persisted state transition provides the idempotency guarantee.
Inbound follows the same persistence rule. A provider reply is normalized before it reaches the protocol runtime. The runtime checks whether it has already seen the event, records the conversation, applies the answer or keyword, and decides what comes next. A duplicate webhook becomes a no-op, while a failed event remains available for recovery.
Inbound processing has two useful protection points. The worker reserves a new envelope before it writes the inbound transcript, and the runtime claims the signal or keyword before applying participant state changes. Those claims use separate idempotency scopes, so a redelivered Redis entry cannot create a second transcript and a repeated runtime call cannot schedule the same follow-up twice. The protocol still evaluates the current open poll and participant state after the claim; idempotency prevents duplicate work, but it does not replace the state machine.
Those cases took longer than the first send, but they removed the failures I was most worried about.
The module boundaries follow those responsibilities: protocol authoring owns the write-side model, protocol runtime owns state transitions, scheduling owns due work and wake publication, channels owns transport and receipts, simulation owns virtual execution, and participant owns enrollment and identity. A provider adapter cannot decide which graph node runs next, and a graph condition does not know how a Twilio request is formatted.
The two asynchronous contracts are versioned separately. JSON bundles use their own schema version for import/export. Redis events use a stream-envelope version for worker handoffs. A change to the reviewable protocol file should not silently become a worker payload migration, and a worker payload change should not invalidate every exported study definition.
Following one message through the system
The easiest way for me to understand ezmsg is to follow one message all the way through it.
Imagine a protocol node that sends a reminder after a participant misses a poll. The author creates that relationship in Dash Messaging. The User API stores the graph and the timing rule in Postgres. When the participant reaches the right state, the runtime resolves the timing anchor and creates a pending scheduled message. At this point nothing has touched Twilio. The system has only recorded a durable decision that a message may become due.
The wake pipeline then moves that decision through three separate stages: enqueue, publish, and consume. Enqueue discovers due rows and stages an outbox record. Publish claims the outbox with database locking and writes a typed, versioned event into the correct Redis Stream. Consume claims the stream entry through a consumer group, reloads the scheduled message and participant state, and asks the runtime to evaluate the current state again.
That second evaluation is important. The message may have been valid when it was scheduled and invalid by the time a worker reaches it. A participant could have answered the poll, a project could have been paused, or a terminal branch could have cleared pending work. The worker does not trust an old queue payload to make a new state transition.
If the message is still eligible, the channel gateway resolves the participant's encrypted destination and provider credentials in the dispatch path, renders the common message payload into the provider's wire format, and records the provider result. The runtime then completes the outbound step and evaluates child nodes. If the worker repeats the same completion, the persisted advancement marker and idempotency record make the second attempt harmless.
When the participant replies, the direction reverses. Webhook ingress verifies the provider signature and normalizes the event. The inbound worker consumes it asynchronously, claims the event's idempotency key, and hands it to the runtime. The runtime checks keywords first, then open polls and signal handling, writes the participant state change, and schedules any follow-up through the same outbound pipeline.
Following one message exposes the handoffs: durable state proposes the next action, workers move it, the runtime checks it against the current participant state, and the result becomes new durable state. A failure at one handoff leaves a recoverable record instead of creating a second conversation.
The channel layer: turn one protocol into different deliveries
The protocol should not need to know whether a message is going to a phone number, the mobile app, or a simulator. That belongs to the channel layer.
For SMS and MMS, I built a provider boundary around Twilio. The runtime produces a message with text and optional media. The channel adapter turns that into the form the provider expects, sends it, translates the provider's status back into platform state, and keeps the provider-specific details out of the rest of ezmsg.
The provider registry is what lets that boundary stay replaceable. The runtime asks for a channel capability; the registry selects the provider and adapter for that channel. Twilio, the in-app channel, mock delivery, and simulation can implement the same delivery contract without putting provider conditionals into protocol execution.
SMS is straightforward: text goes out as text. MMS needs separate handling. A web link is not the same thing as an image attachment, and the provider validates media types on its side. I split the delivery so ordinary links stay in the message body while images and videos become real media attachments. Text is sent first, then media is delivered separately when it exists. If the media leg fails, the already-delivered text is still preserved and the failure remains visible for recovery.
Inbound uses the channel adapter in the other direction. The webhook is verified before it is accepted, phone numbers are normalized, and the provider payload is converted into the common event shape used by the runtime. Delivery receipts and participant replies become different kinds of events, even though both arrive through the provider webhook. The adapter gives the runtime a common conversation event instead of Twilio-specific form fields.
I also had to account for an unpleasant provider case: a network error does not prove that Twilio rejected a message. The adapter classifies provider failures as retryable, permanent, or ambiguous. Ambiguous attempts are reconciled through the provider message record before a blind retry is considered. That protects against the classic “timeout, retry, duplicate SMS” failure.
The SMS/MMS screenshots below show why the channel is part of the data model. Media, links, replies, receipts, and failures all need a representation the runtime can understand.
The console: make a complicated system feel calm
The web console exists because a protocol should not require an engineer to edit database rows or configuration files.
Dash Messaging is built with Next.js, React, and TypeScript. React Flow handles the graph-shaped parts of the editor. Tailwind and shadcn provide the visual system. The backend publishes an OpenAPI contract, and the UI generates its typed client from that contract. The client keeps request shapes and error handling consistent across the console.
The hard decisions sit between the screen and the API: how data is shaped, how mutations are authenticated, and which parts of the console are revalidated after a change.
I use a small application layer between components and the generated client: reads shape data for screens, mutators perform authenticated changes, and server actions decide what to revalidate after a mutation. Components do not each invent their own fetch, auth, or error-handling behavior. That is how the console stays consistent as the protocol surface grows.
Server actions keep authenticated backend calls on the server. They attach idempotency keys for operations that can be retried, translate authorization and conflict responses into useful messages, and revalidate the pages that depend on the changed resource. A template edit can affect a node, a timing rule, and the project overview, so invalidating only the form that was open would leave the console showing stale protocol state.
The protocol editor understands that a node can depend on a message, a condition, a timing rule, a variable, and a parent node. It can warn about an incomplete relationship before the save reaches the backend, while the simulation can catch behavior that only appears after the graph runs.
I wanted the console to explain failures in the same way the system handles them. If a save conflicts with another change, the UI should say what happened. If a user cannot perform an operation with their role, the message should say that directly. If an import is unsafe, the author should be able to validate it first. The console needs to name the conflict, permission, or validation problem.
The same idea shaped the simulation screen. It shows the transcript and the messages that are scheduled next, because both are part of understanding a protocol. Live updates arrive through server-sent events, while the UI keeps enough identity information to reconcile a message that was optimistically sent with the version later confirmed by the server.
The SSE connection is proxied through the authenticated Next.js server. The proxy forwards the upstream stream, sends keepalive comments, disables response buffering, and preserves the access boundary. On the client, transcript events are merged by message identity and client idempotency key. While a send is waiting for confirmation, the client holds the ordering until the row that confirms the send arrives.
The authentication bridge keeps the same server-side path. NextAuth holds the UI session, while the ezmsg token exchange and refresh happen on the server. Concurrent refresh attempts share one in-flight refresh, so an expired session does not turn one page load into a burst of competing token requests.
Simulation is a design tool. I can change a branch, move the clock, answer a poll, and see whether the protocol behaves the way I intended.
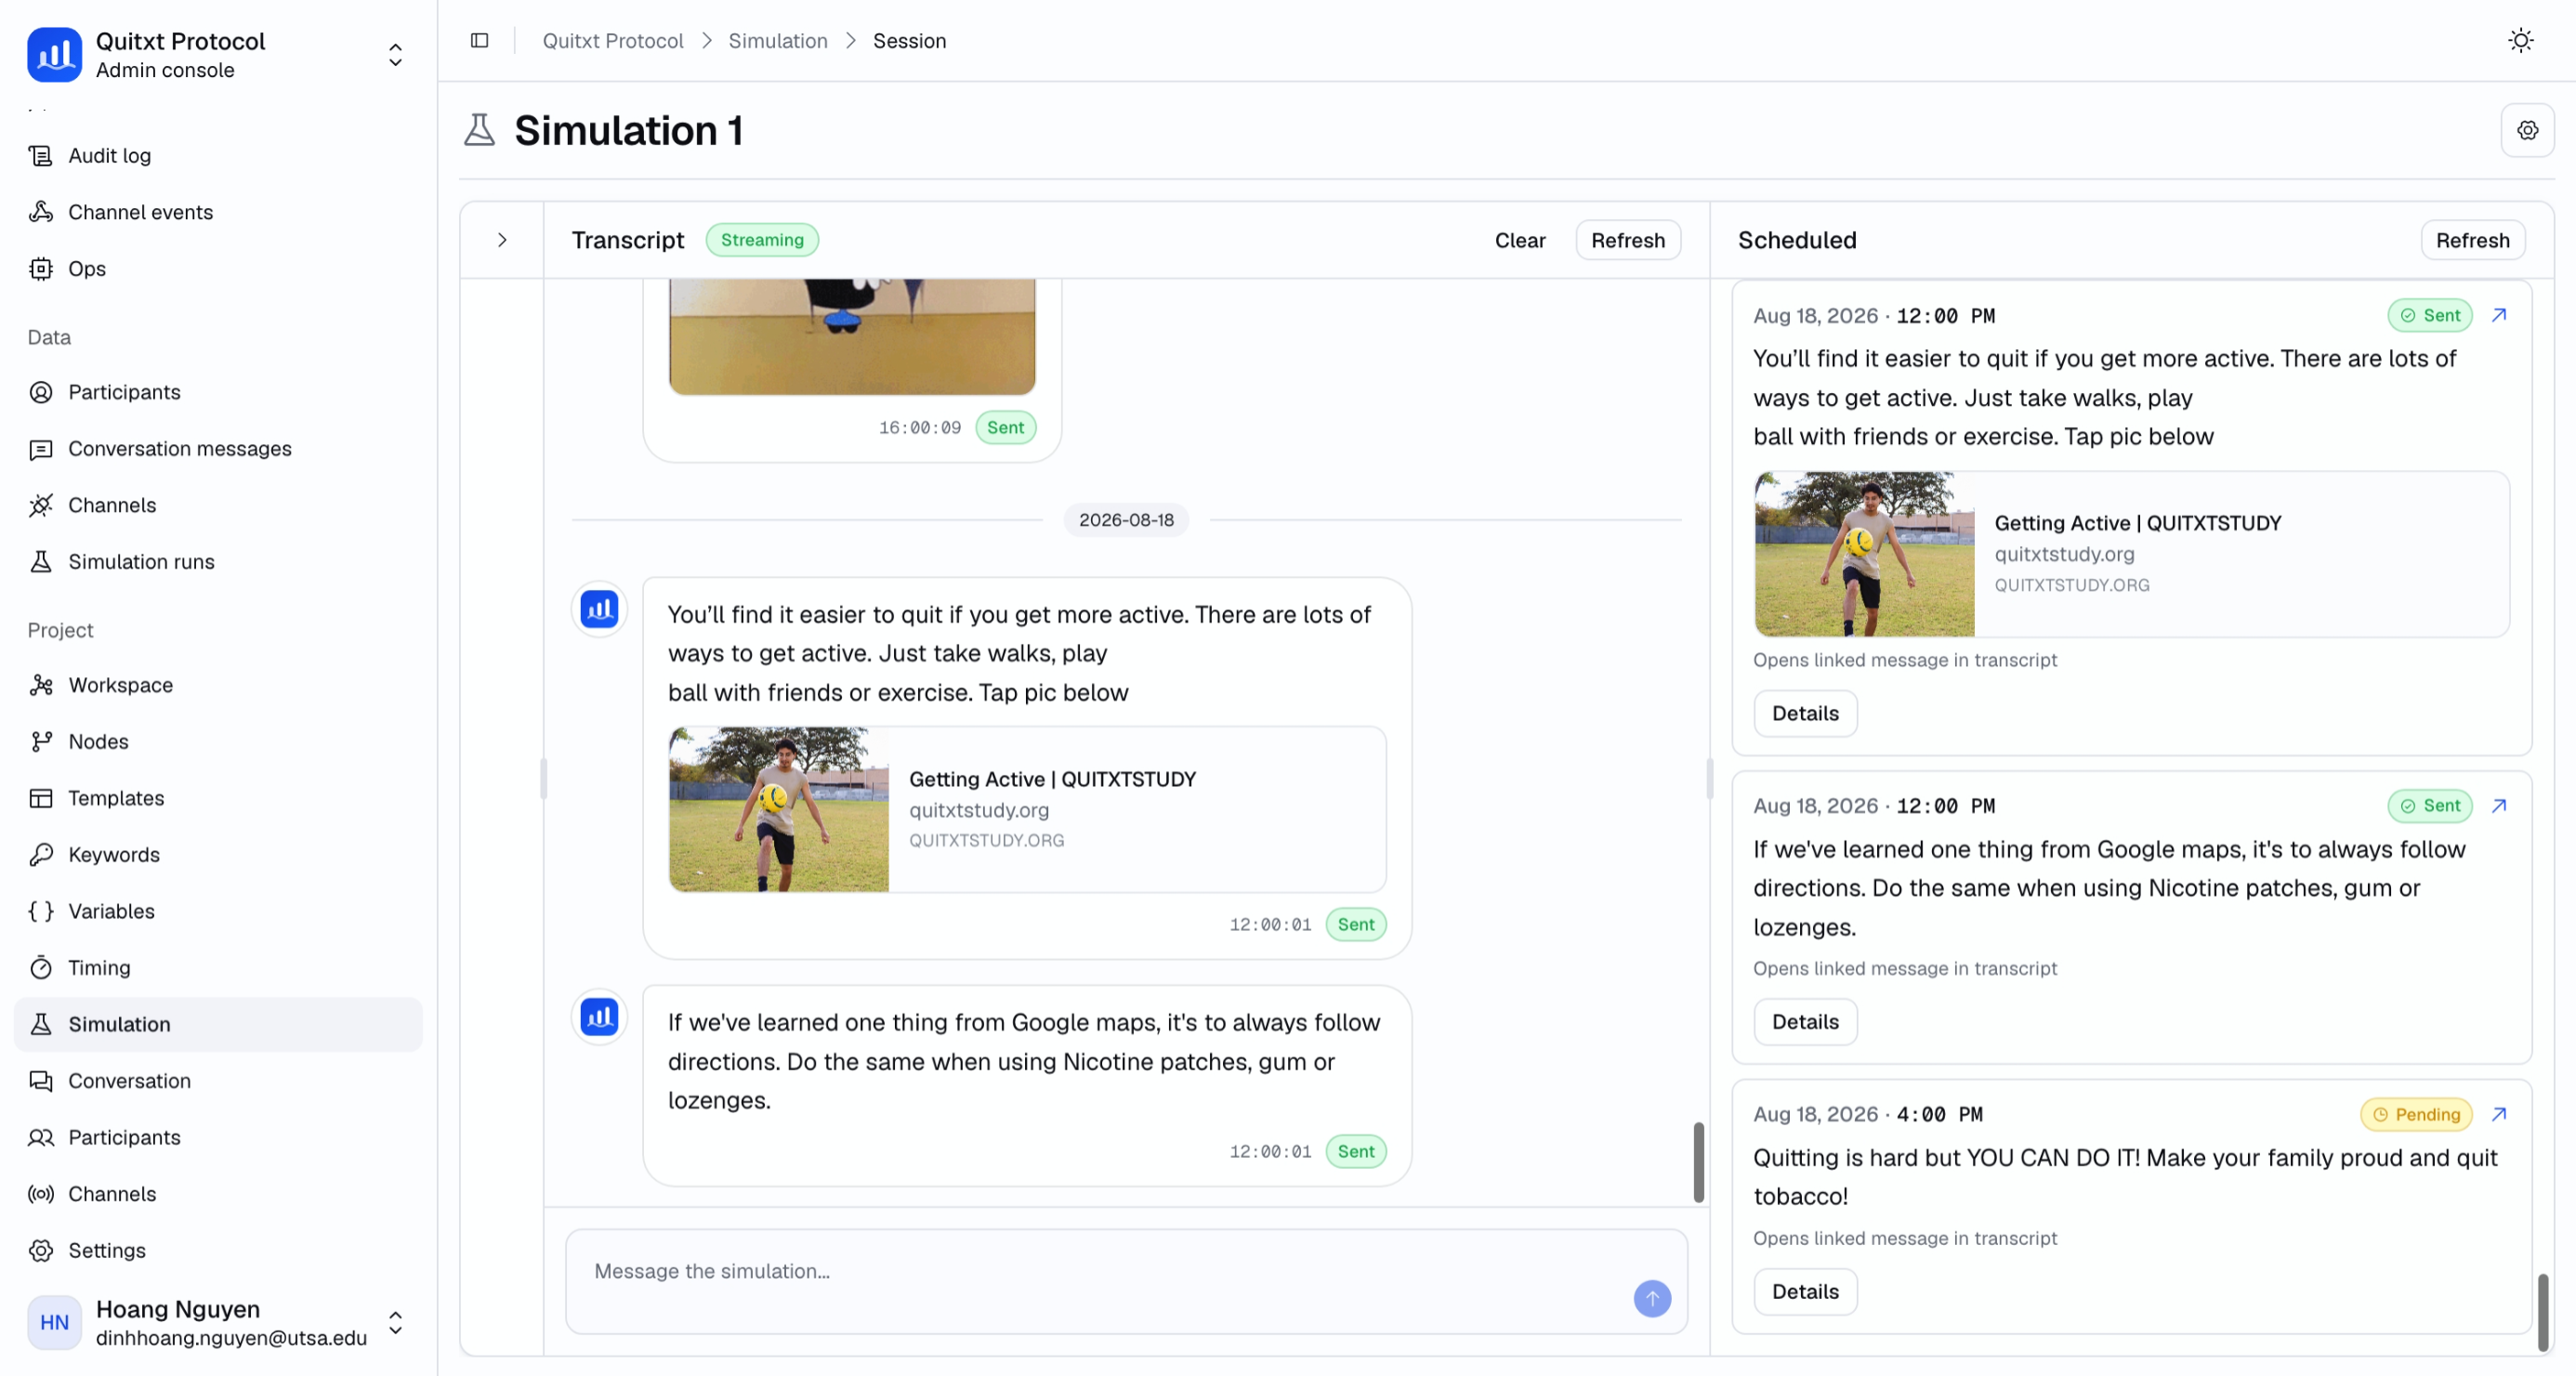
Simulation lets me inspect the conversation before it reaches a real participant.
The mobile app: assume the network will fail
The mobile app changed how I think about the product.
On the console, a slow request is annoying. On a phone, a broken connection can become the entire experience. A participant should not open a conversation and see an empty screen just because the latest request has not finished. They should not lose the message they just sent because the app went offline at the wrong moment.
ezmapp is built with Flutter and Dart. It uses a local SQLite database to keep the conversation available on the device, and a repository layer to reconcile that local copy with the remote API and live events.
The app opens a conversation from its local cache first. It then fetches newer messages, stores them, and listens for live updates. When the user scrolls upward, it loads older pages without jumping the conversation away from the message they were reading. When a new message arrives, the app decides whether to scroll for the user or show a small “new messages” affordance based on where they are in the conversation.
The cached repository is the single synchronization point. It writes remote pages and live events to SQLite before exposing them to the view model. The local schema stores messages, conversation state, previews, and a pending outbox for optimistic sends. The UI never opens the database directly, and the view model never makes a network request.
Every network result is normalized at the repository boundary. A REST page, an SSE batch, and the response to an optimistic send pass through the same local merge path. The per-project cursor and client idempotency key are stored beside the messages, so a restart does not erase the information needed to reconcile a pending send or resume a stream. The view model observes one ordered local conversation, while the repository handles the three remote response types.
Sending is optimistic. The message appears immediately, gets a pending state, and is matched with the server response later. If the network fails, the message stays visible and can be retried. Recovery is part of the normal chat model because the connection will fail sometimes.
The live connection also has a recovery path. The app keeps a cursor based on the newest message it has seen. After a disconnect, it catches up through REST from that cursor, then reconnects to the event stream with exponential backoff and jitter. Local messages and server messages are deduplicated before the screen sees them. The view model receives one conversation whether a message came from SQLite, a REST response, or a live event.
The event parser is incremental and treats SSE comments as keepalives, not messages. Catch-up is bounded: after a send or a reconnect, the app performs a targeted delta fetch when needed. The composer does not depend on a perfectly timely stream or a polling loop.
This keeps the widgets focused on presentation. The repository owns synchronization, and the local database gives the product memory across restarts.
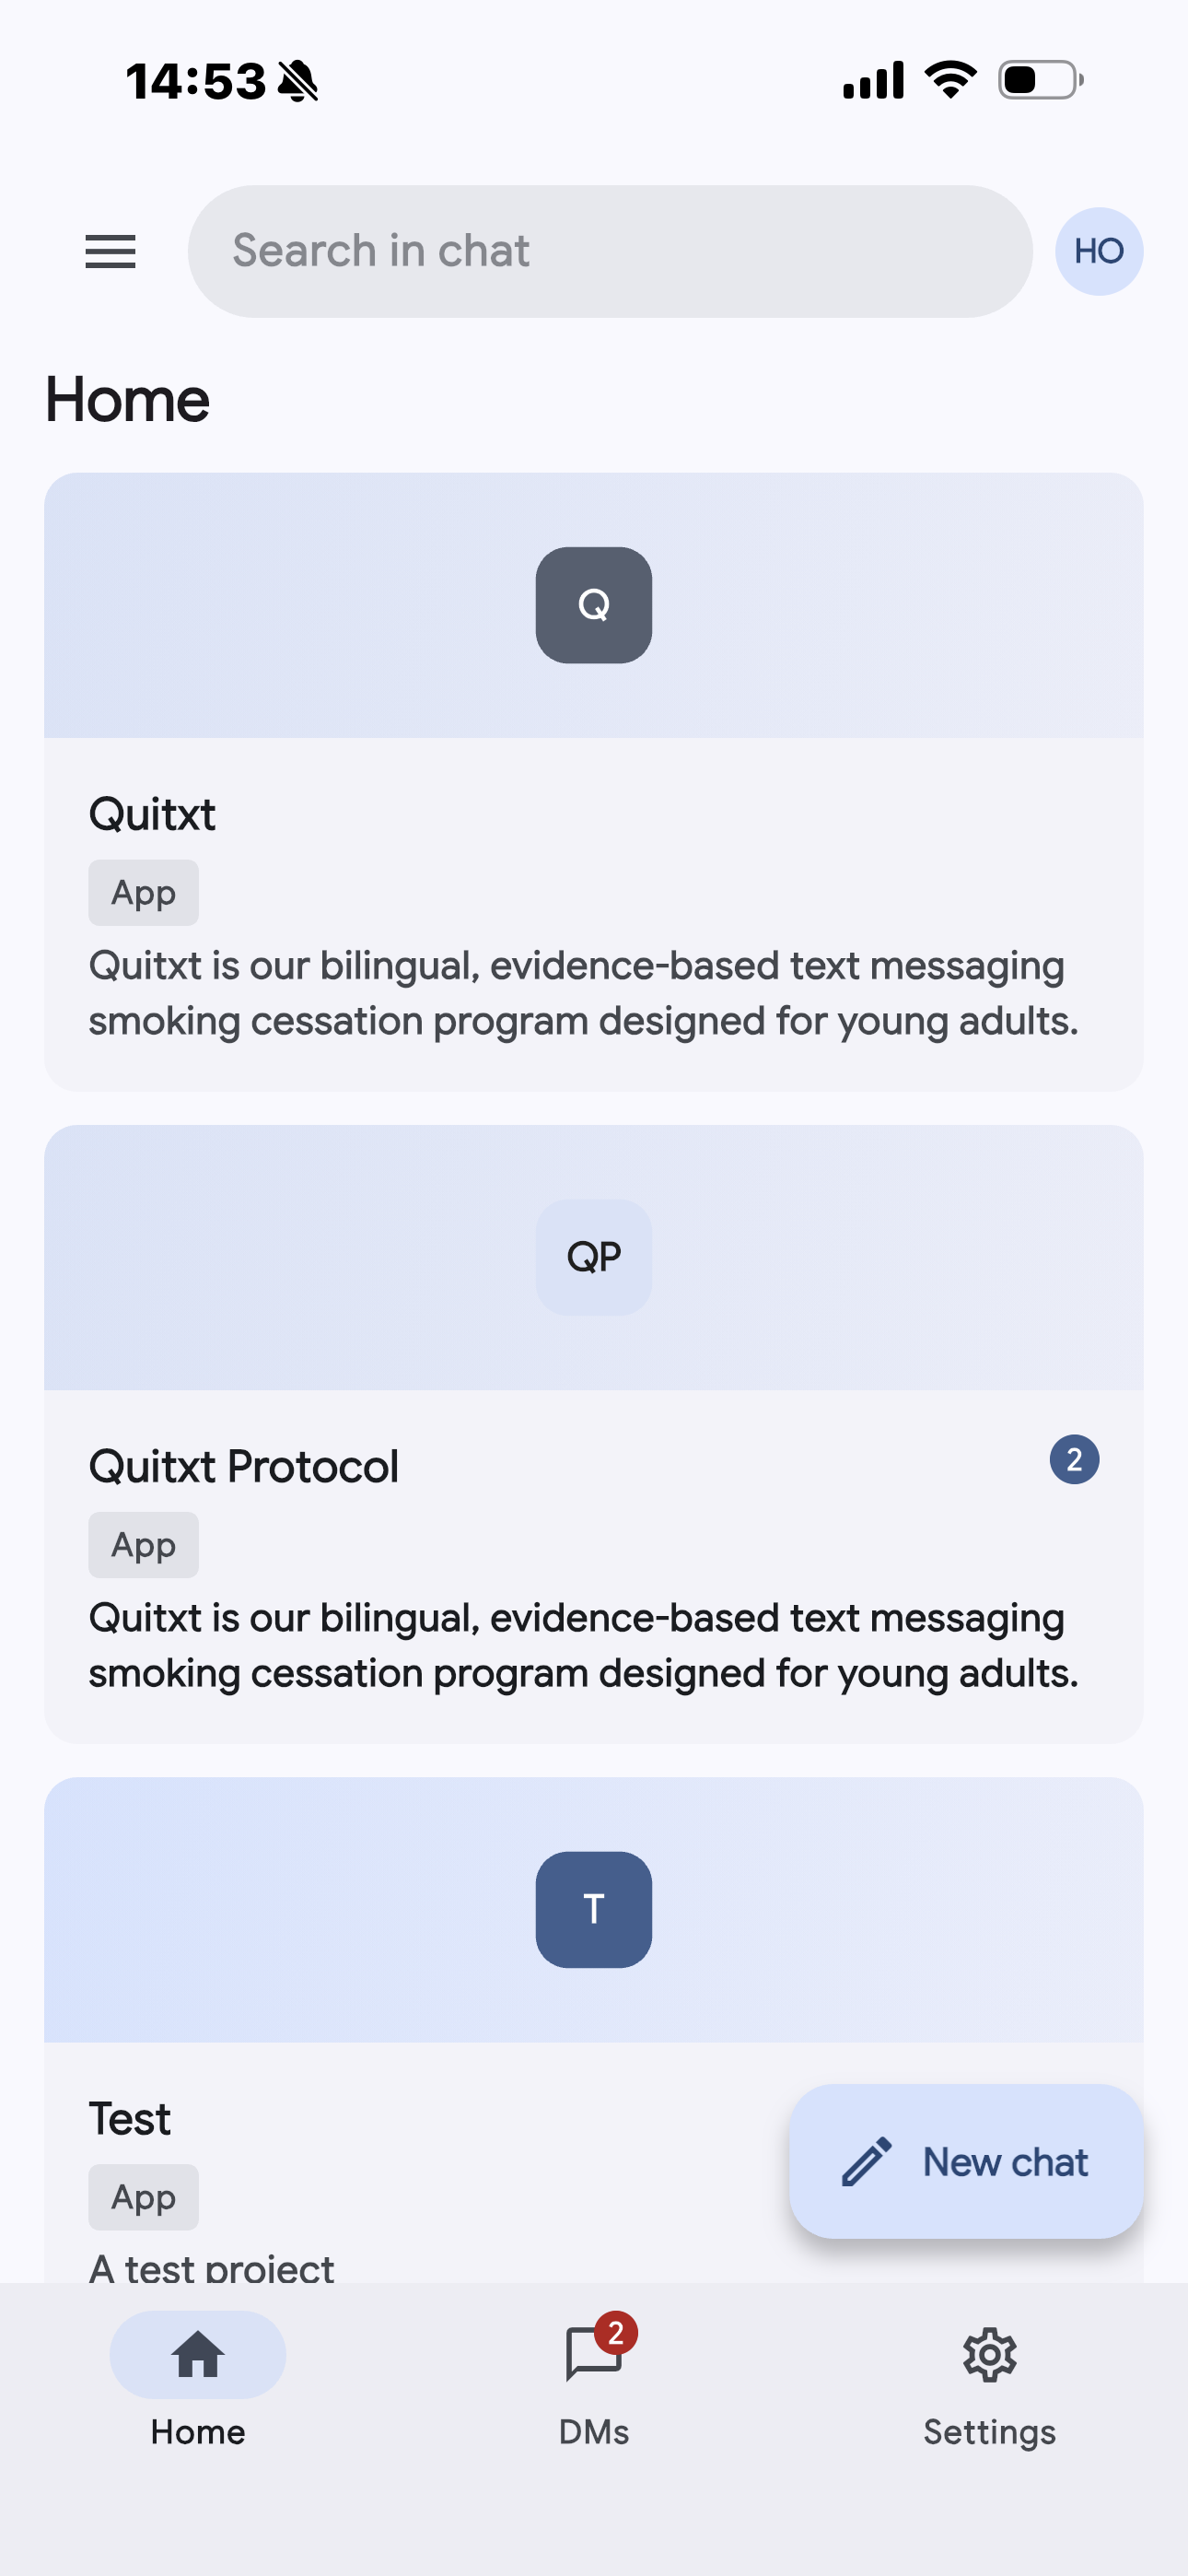
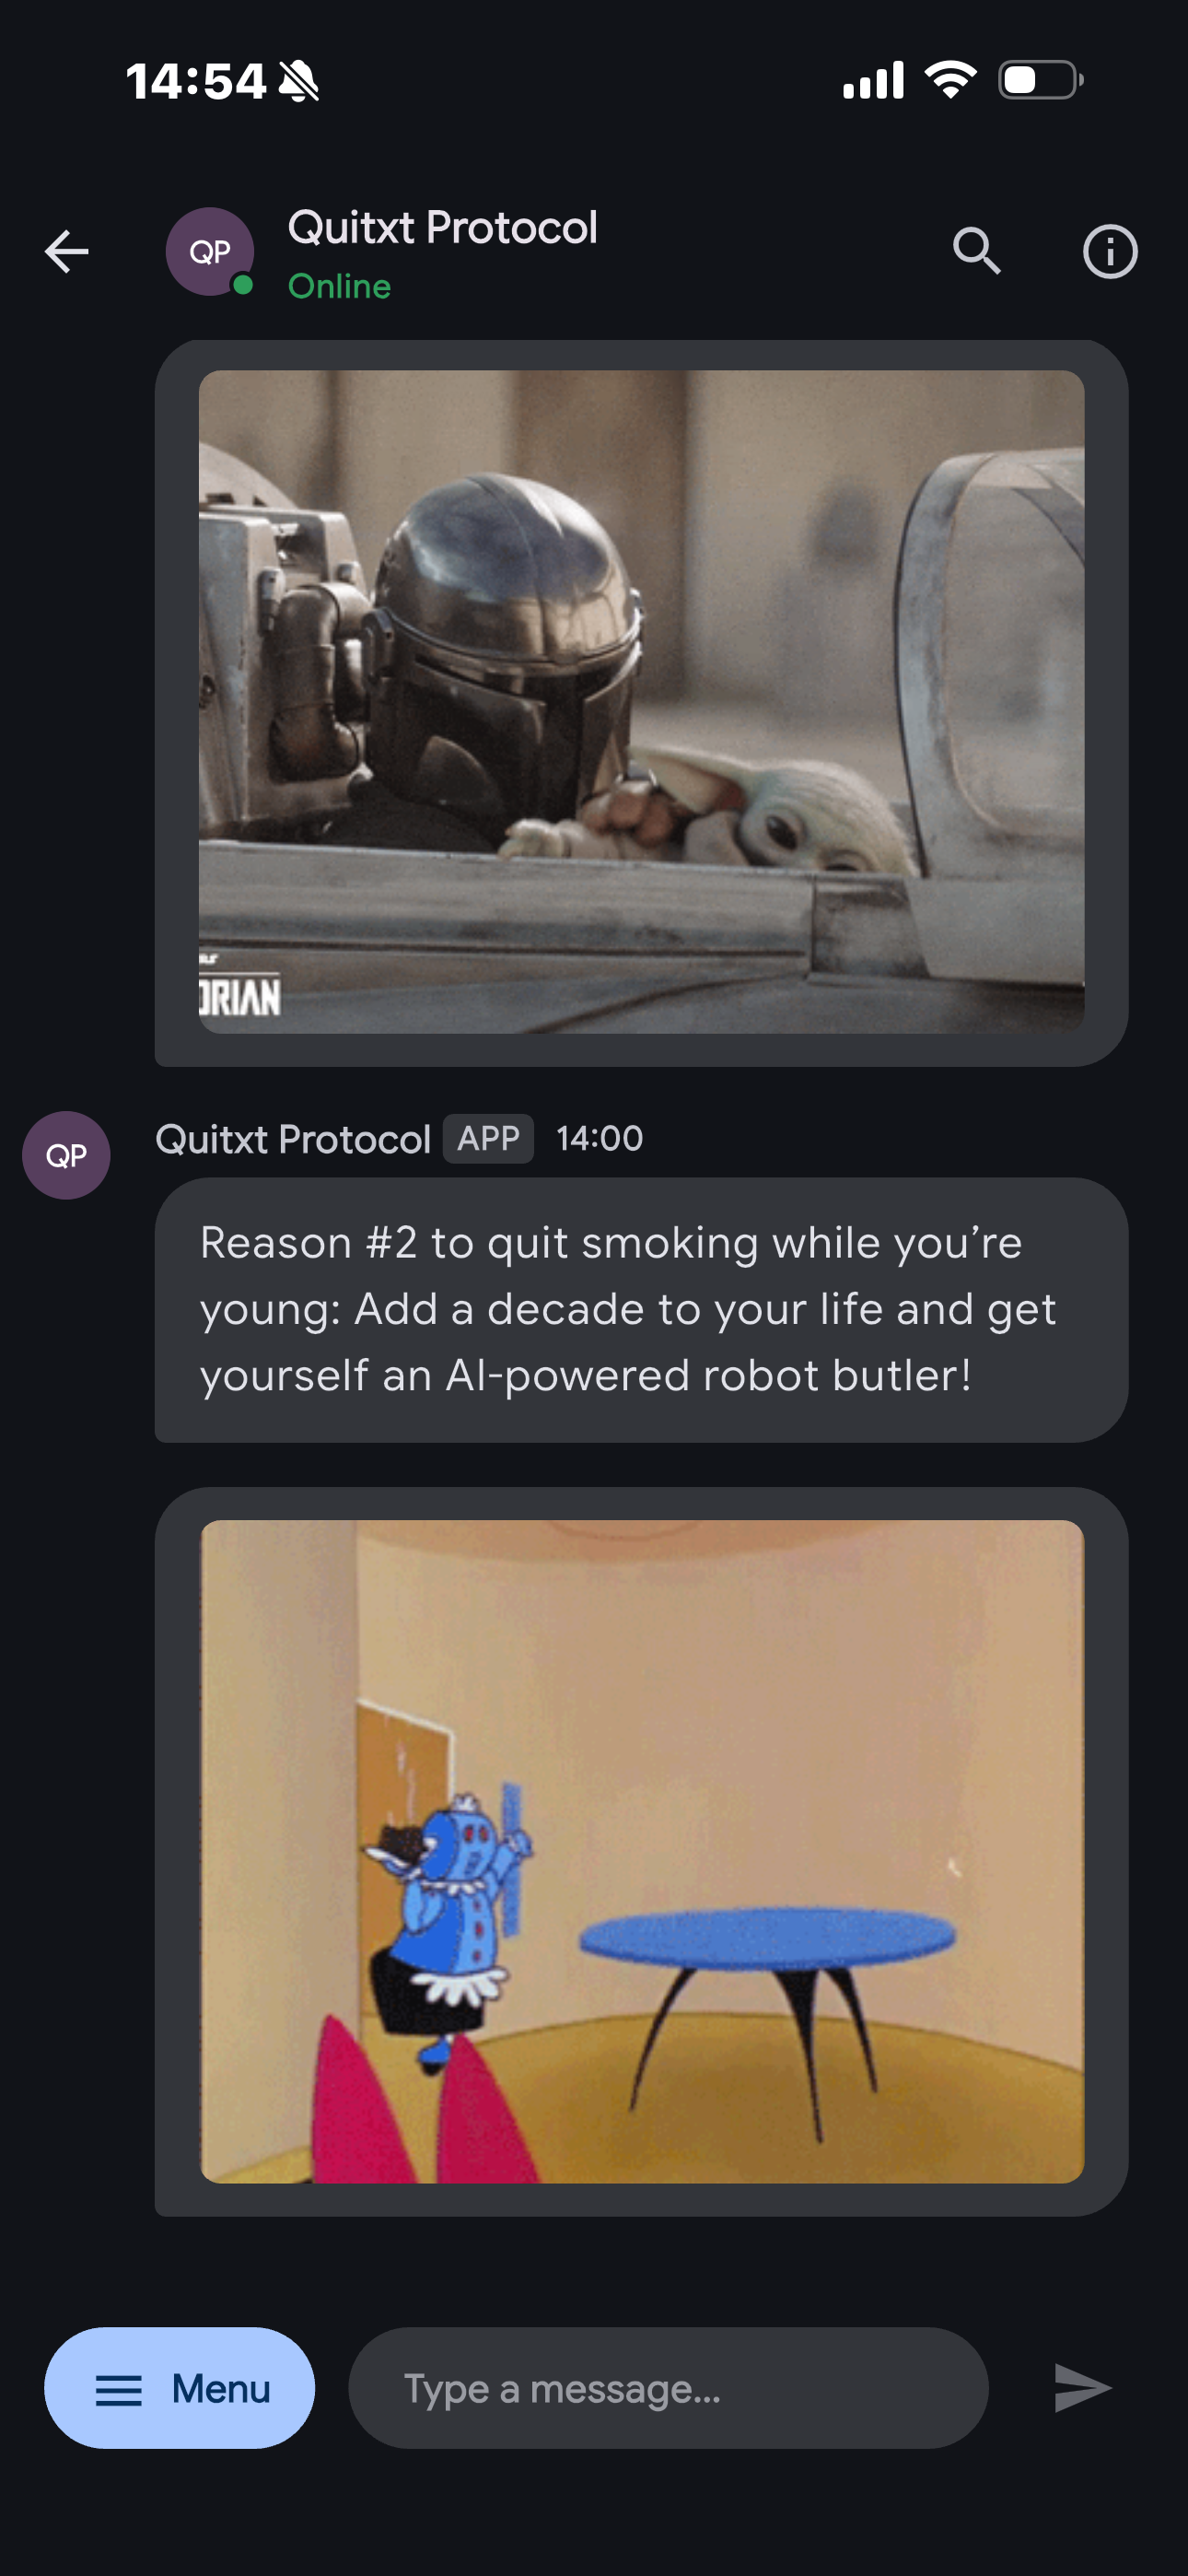
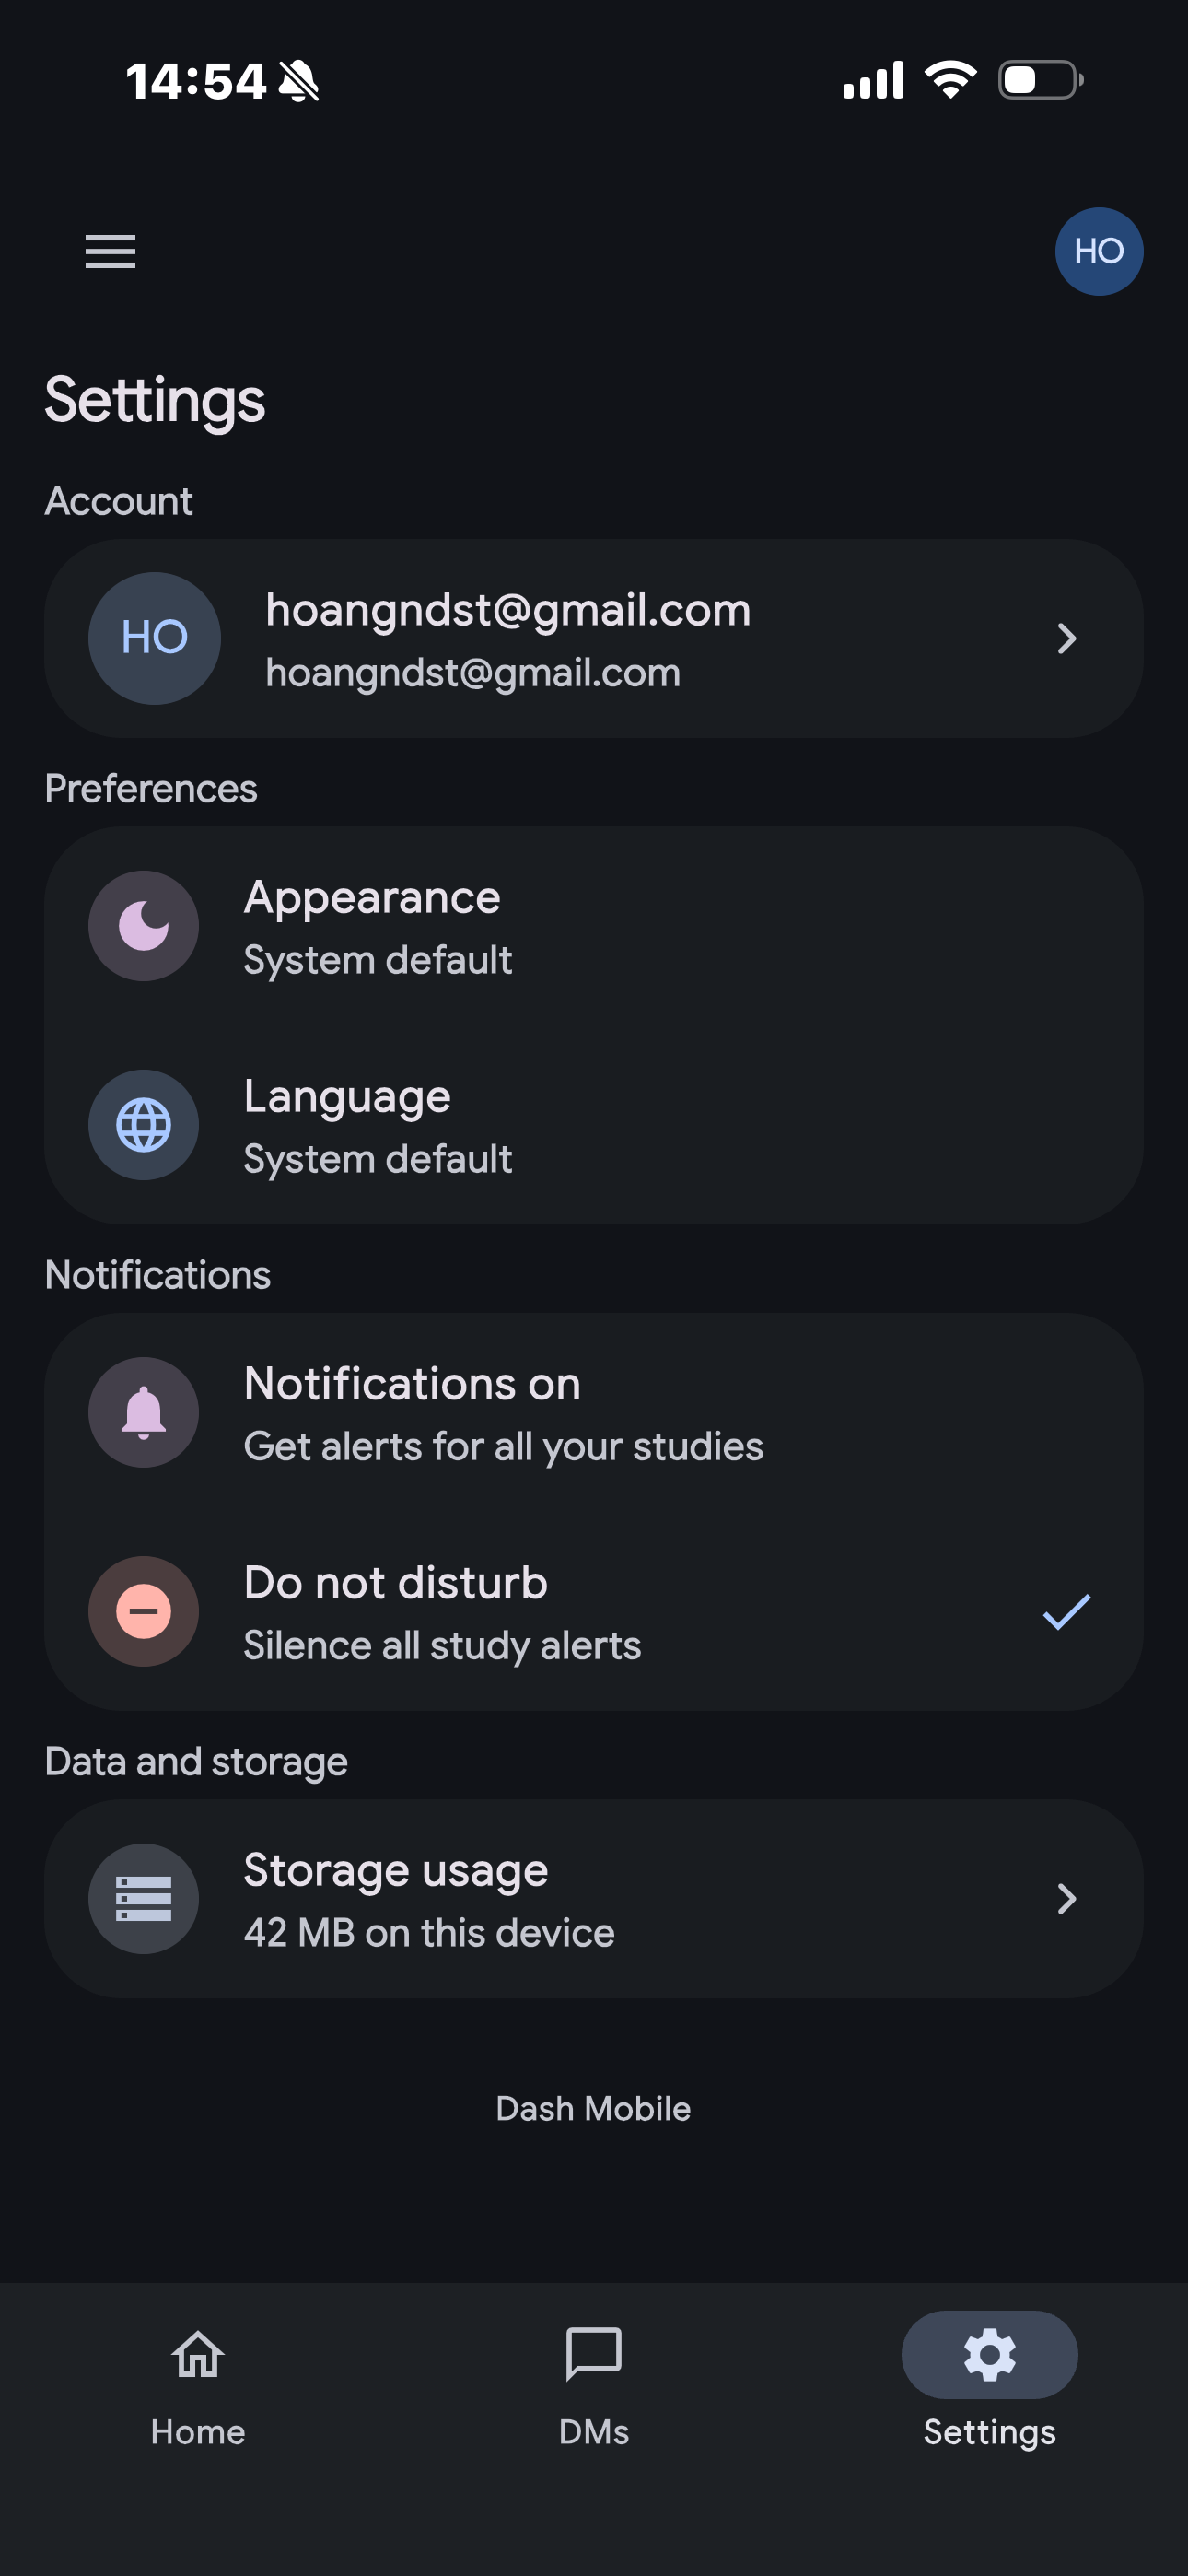
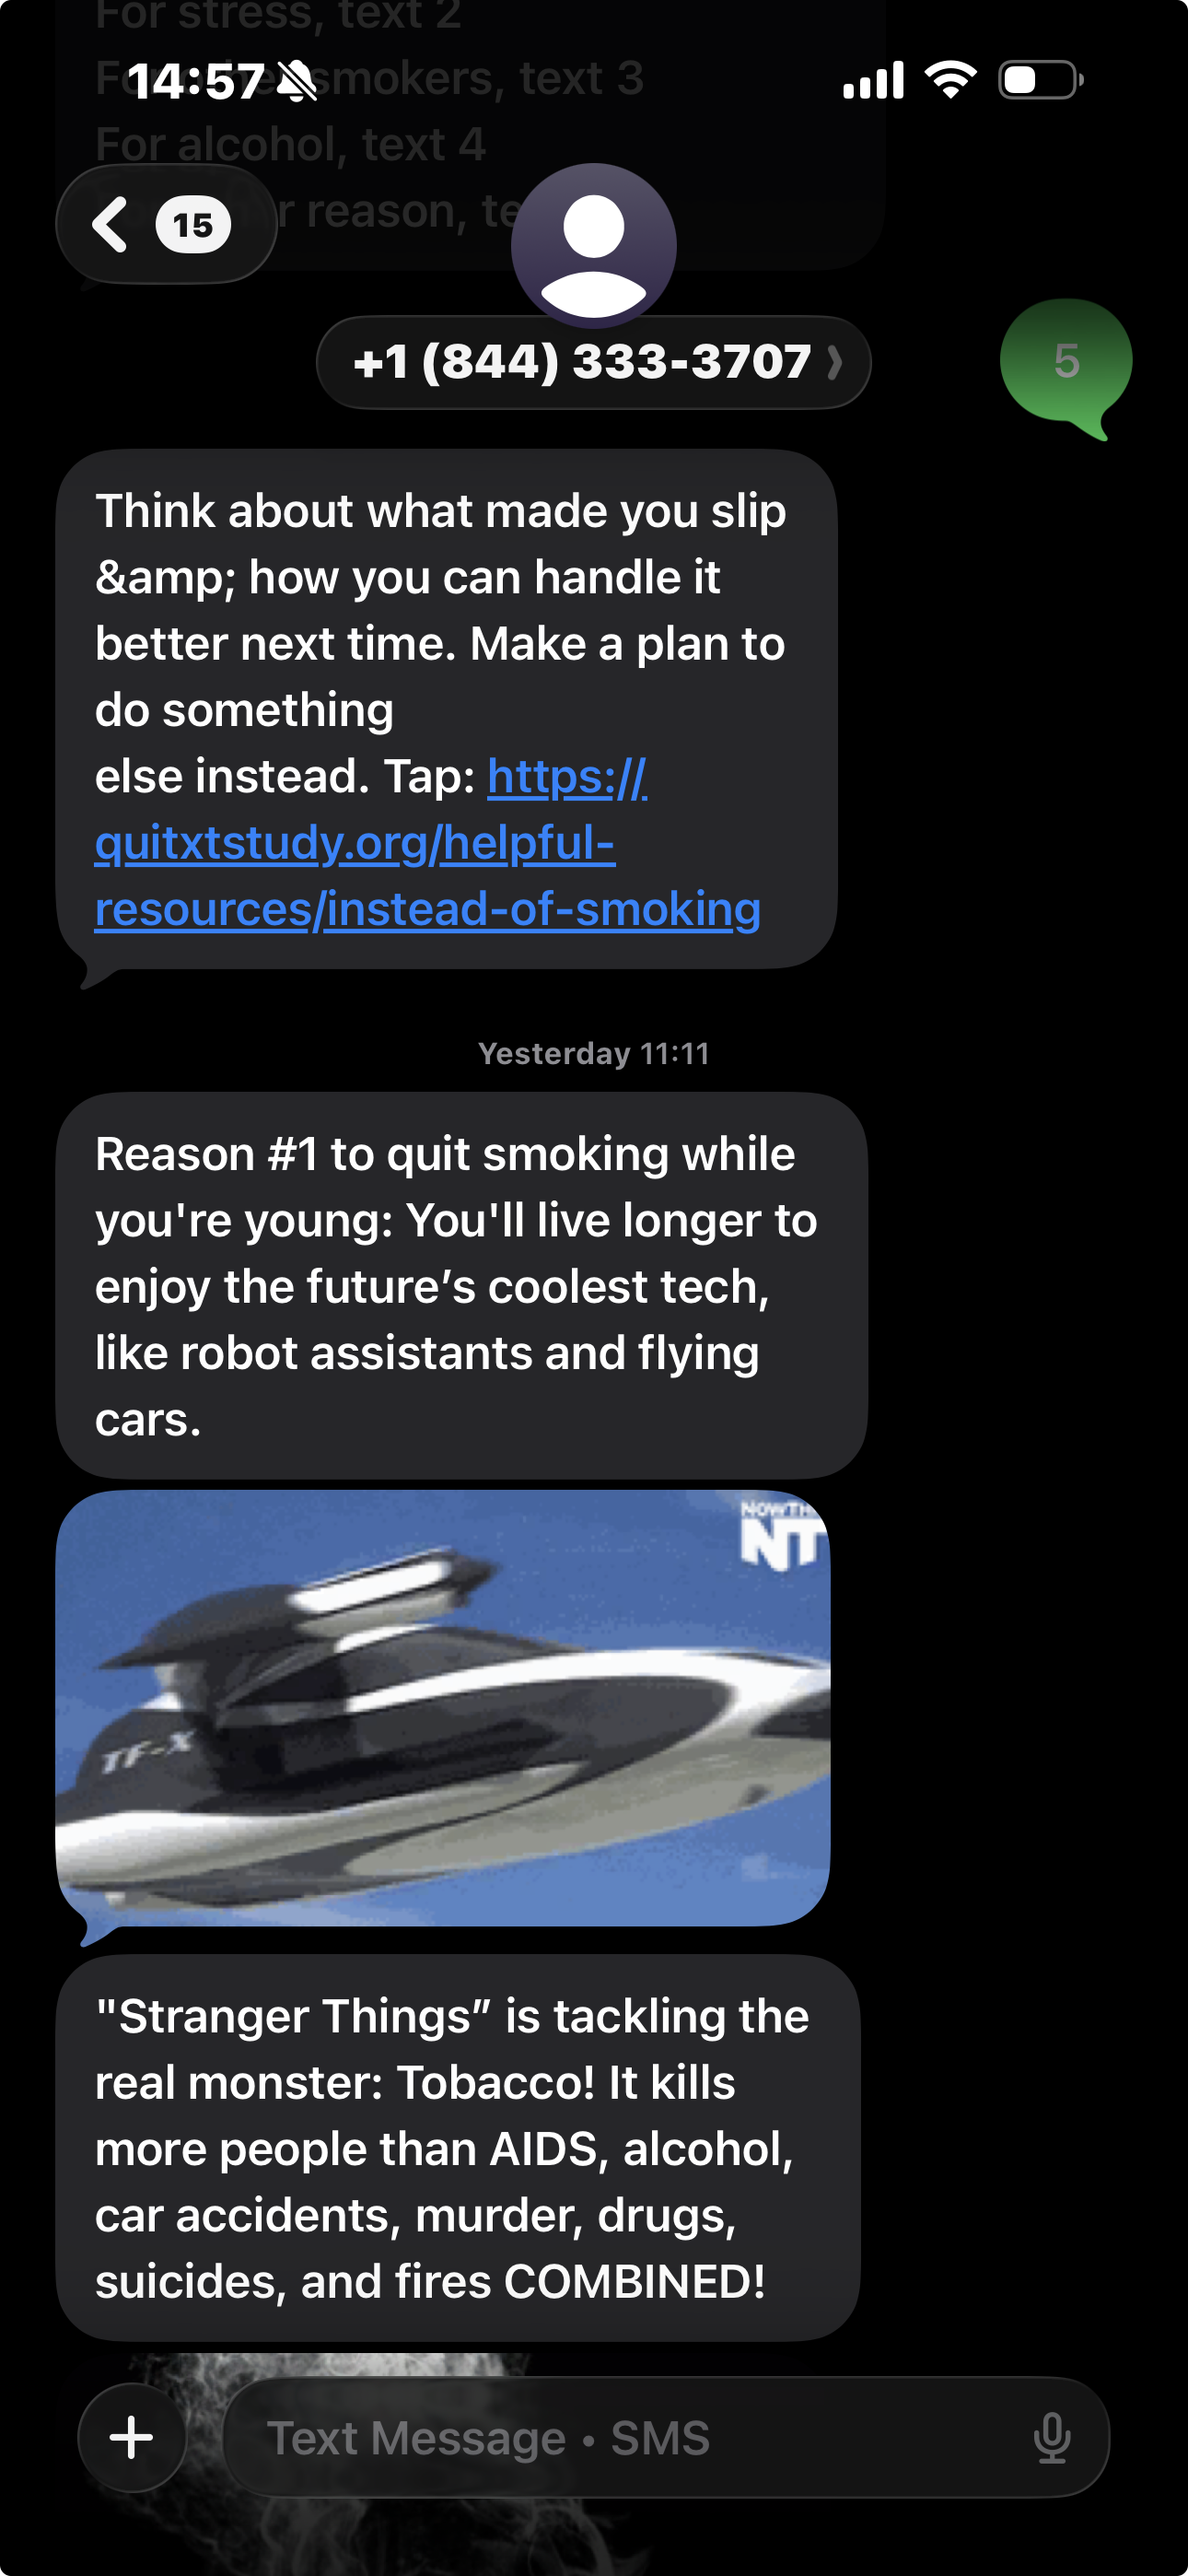
The participant experience beside the SMS/MMS delivery surface: choose a study, follow the conversation, and control the local experience.
Monitoring: know where the conversation stopped
When a message does not arrive, I start with its scheduled state and follow the handoffs from there.
I built the monitoring stack around the path a message takes. Prometheus collects application and worker metrics. Grafana turns them into dashboards. Loki collects structured logs. OpenTelemetry and Jaeger help trace requests through the HTTP services. Exporters cover the surrounding database, Redis, containers, and host.
The HTTP services expose both liveness and readiness. Liveness answers whether the process is running. Readiness includes a database check, so a process that cannot reach Postgres does not advertise itself as ready. The APIs are instrumented for request volume, status, duration, and in-progress work. The worker loop reports its own last successful iteration, which catches a process that is alive enough to answer a scrape but no longer doing useful work.
Prometheus scrapes the API processes, workers, exporters, black-box probes, and OpenTelemetry span metrics on a short interval. The OpenTelemetry collector receives HTTP traces, forwards them to Jaeger, and turns spans into Prometheus-compatible metrics. Loki receives structured JSON logs through Promtail. The point is not to collect every possible signal; it is to let one request ID connect an API decision to the worker progress and durable state that followed it.
I care about a few practical questions:
- Are the APIs alive and connected to the database?
- Are the workers actually making progress, or are they only still running?
- Is work waiting in Redis, or has it been claimed and left unfinished?
- Did the provider respond?
- Did the protocol advance after the delivery?
The dashboards are organized around those questions. A worker can be technically up while its last successful loop happened a long time ago, so I monitor progress as well as process health. Redis backlog and consumer lag tell me whether the problem is a slow consumer or work that has already been claimed. API traces and structured logs help connect a request to the decision that followed it.
Pending work and consumer lag lead to different investigations. Lag means the consumer group has not caught up with the stream. Pending work means a consumer claimed entries but has not acknowledged them. I keep them as separate signals instead of collapsing them into one queue-depth number. The operations view combines those signals with dead-letter depth, import state, and channel health so an operator can see whether the platform is slow, stuck, or rejecting work.
The operations health calculation uses those signals directly. A non-empty backlog becomes degraded when the worker is alive and making progress. It becomes unhealthy when Redis is unavailable or the worker heartbeat is stale. Inbound work is evaluated separately, with dead-letter entries contributing their own warning. The dashboard distinguishes healthy, degraded, unhealthy, and disabled processors without alerting on every normal queue.
I use the scheduled-message state as the starting point for an investigation. If work is still pending, I check the timing decision and the wake path. If an outbox row exists but has not been published, I look at the publisher and database connectivity. If the Redis entry is visible but pending in the consumer group, I look at the worker that claimed it. If the provider attempt exists but the protocol did not advance, I follow the receipt, runtime completion, and idempotency record. That sequence narrows the failure to one boundary; searching logs for “failed” does not.
The same checks apply to bundle imports. A job stuck in queued points to worker availability; parsing or validating points to the artifact; replacing points to the transactional write; retry_pending points to a transient infrastructure failure. The phase tells me which part of the import is waiting or failed.
I also built an admin-only operations control plane around those signals. It exposes a platform health summary, stream inventory, processor health, import and migration backlogs, channel-event summaries, and dead-letter depth. In a controlled environment an administrator can run one worker step or replay dead-lettered inbound work, and each intervention is written to an operations audit trail. Recovery happens through an explicit, audited operation.
When a message is delayed, I follow it from readiness to worker activity, queue state, API logs, and finally the durable conversation record. Each view answers a narrower question, and together they show where the work stopped.
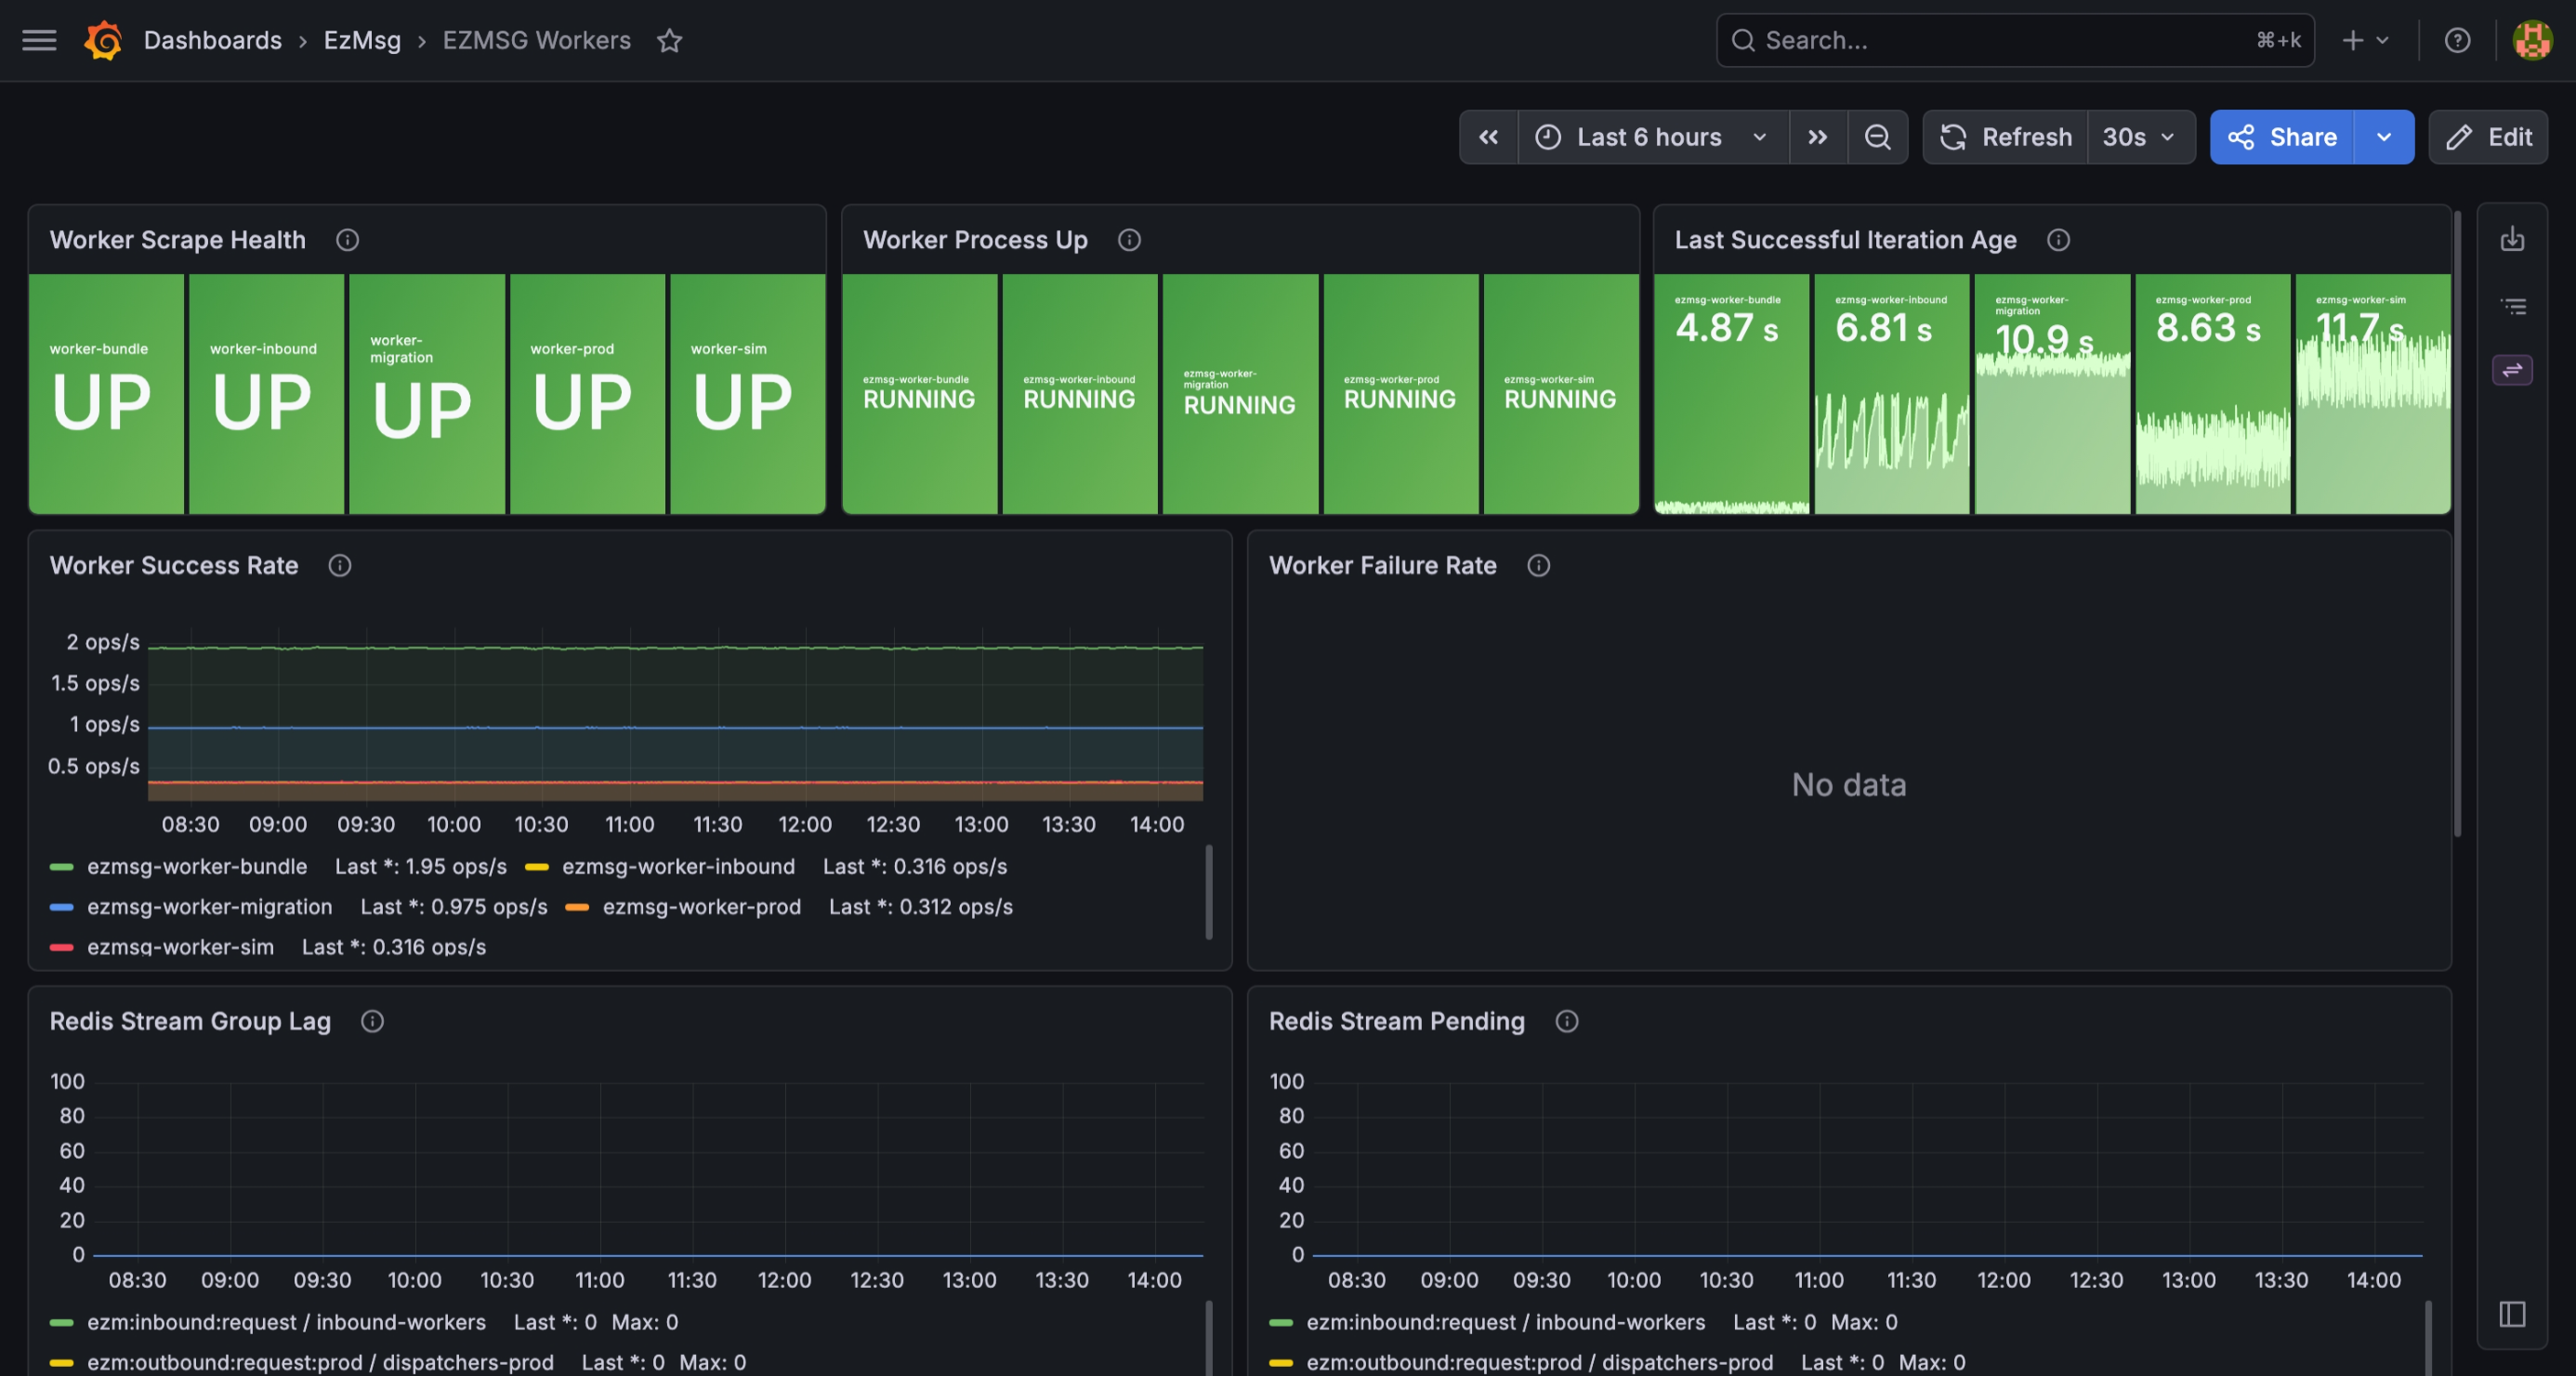
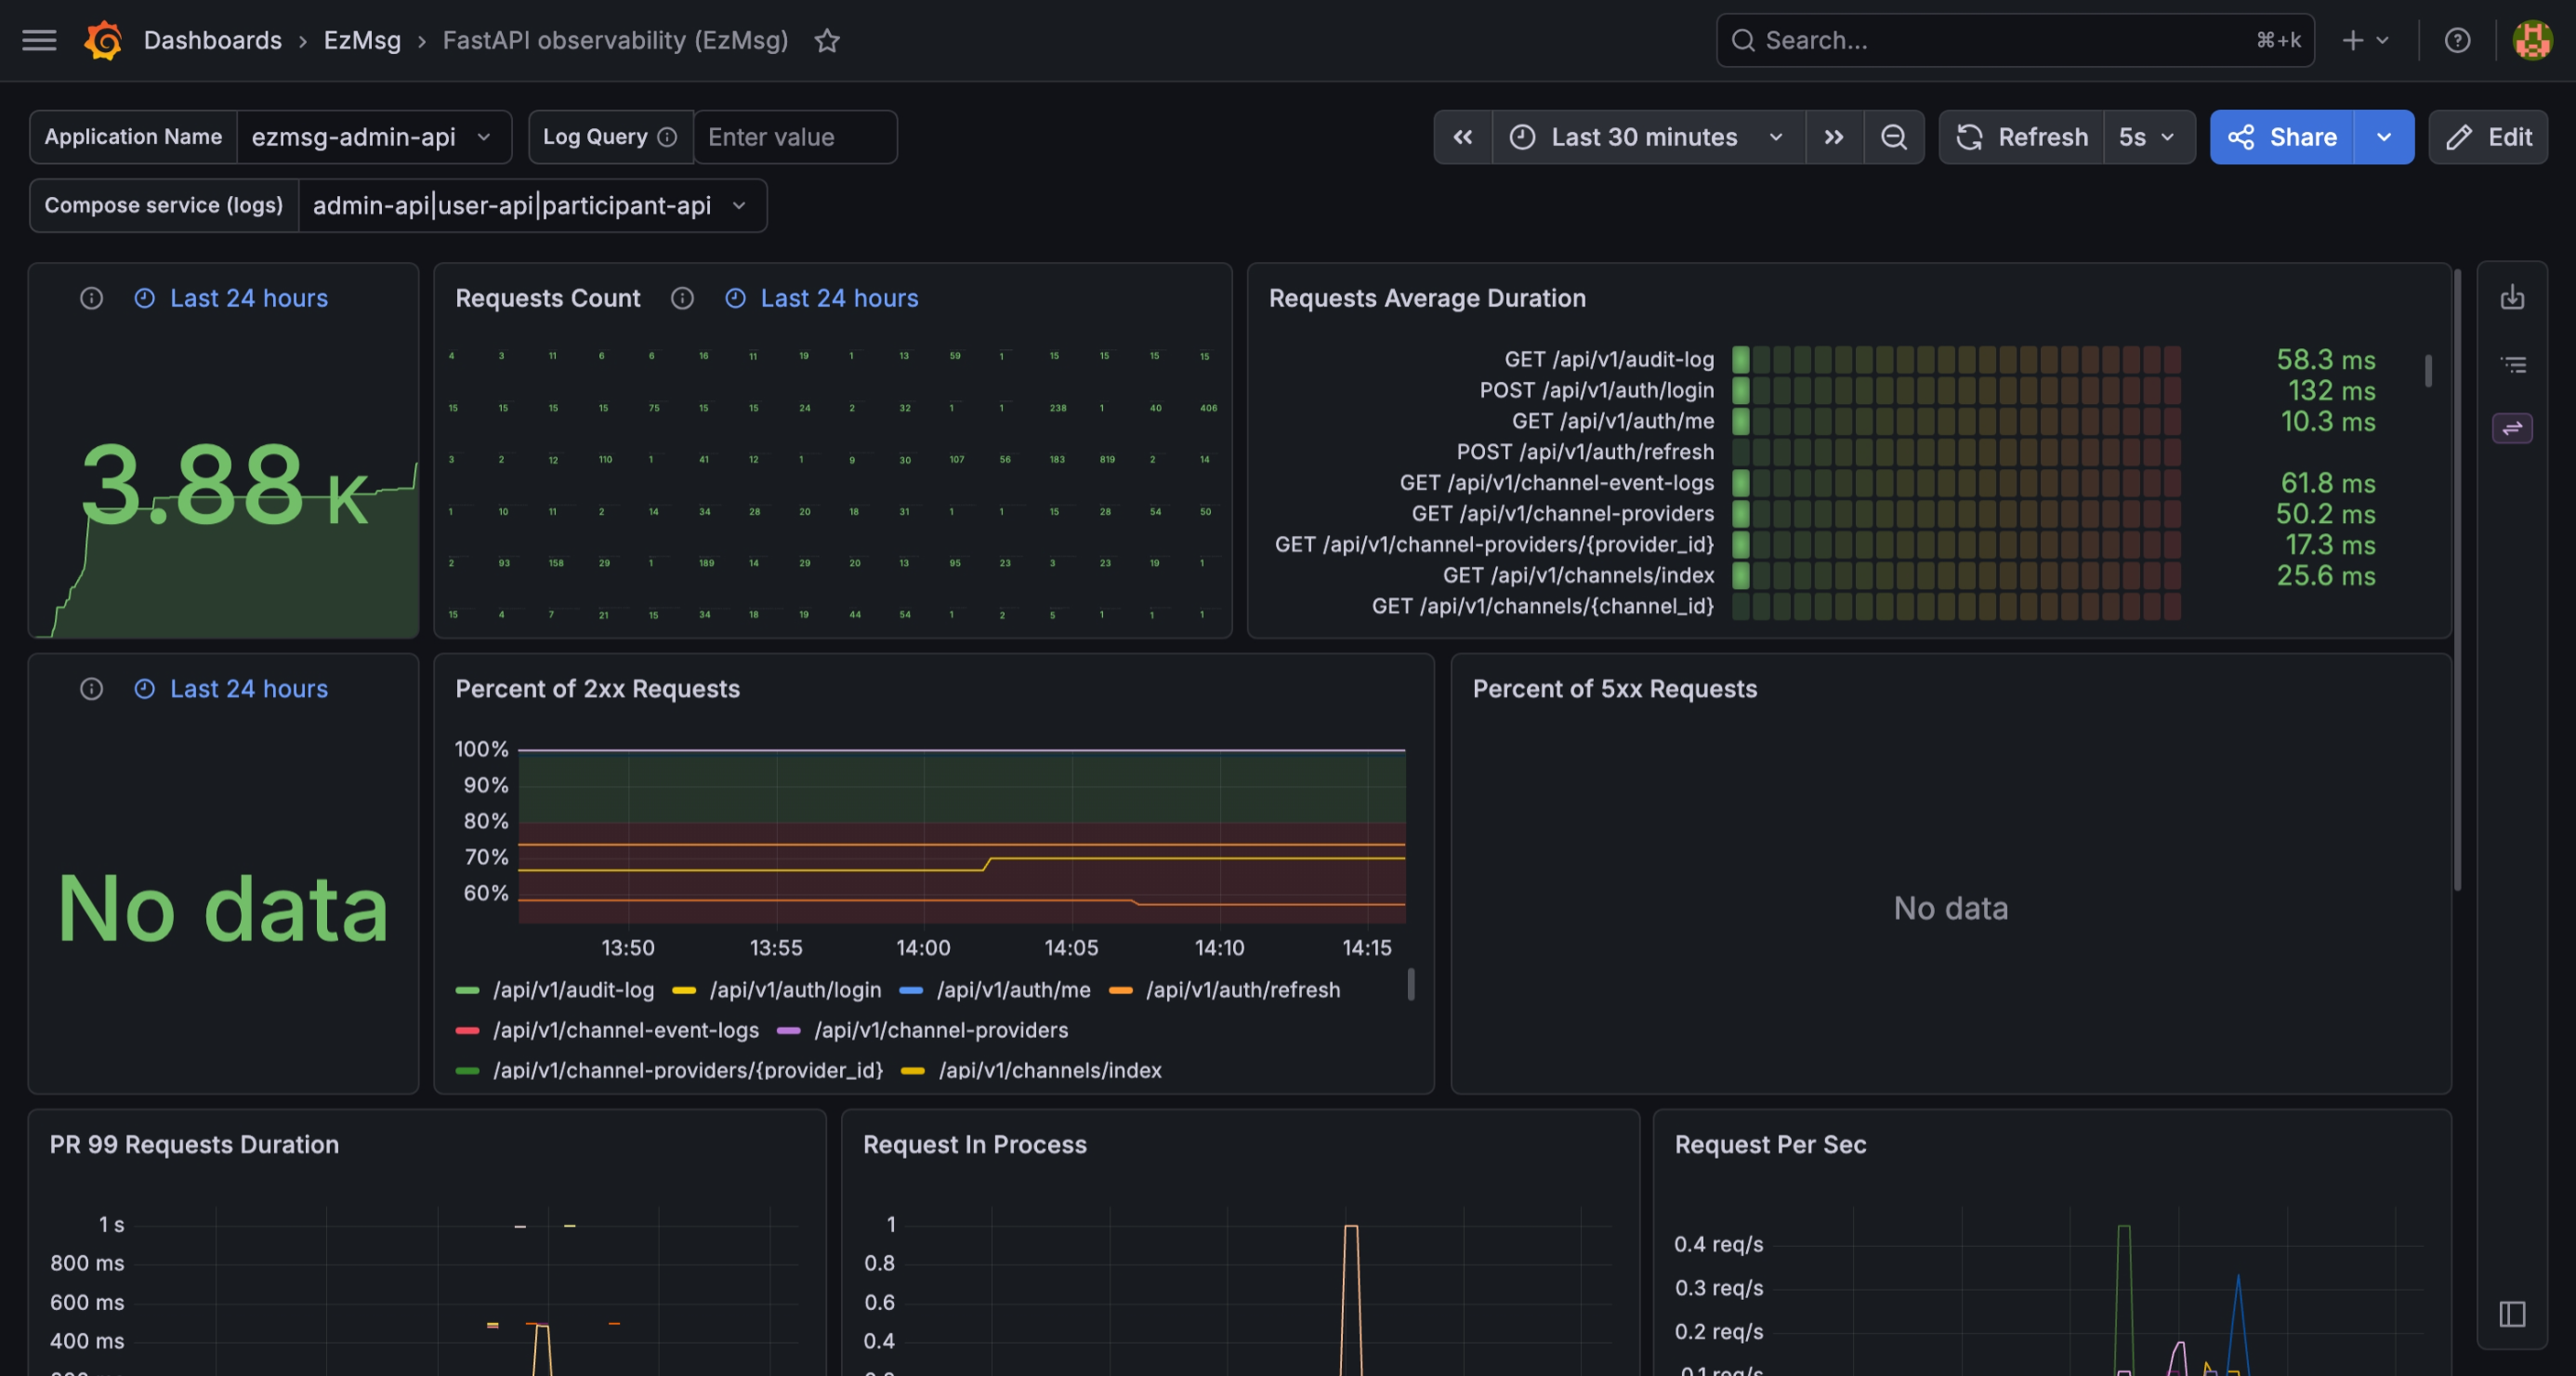
I deploy it on a tiny Dell server
I run the production stack on a small Dell server at home. It is a useful constraint: the machine has to run the application, the workers, and the monitoring tools without turning deployment into a separate platform project. Docker gives each part a boundary I can restart, inspect, and replace.
The backend production Compose file is split by responsibility. Redis runs with append-only persistence. Three FastAPI containers expose the admin, user, and participant APIs. Five worker containers handle production wake-ups, simulation, inbound events, protocol bundle imports, and channel migrations. A worker crash stays local to that worker, and the health checks make a dead process visible to Docker and the monitoring stack.
Postgres is deliberately supplied through the production environment instead of being created by the application Compose file. The production services receive EZM_DATABASE_URL, while the local Compose profile can start Postgres and Redis together for development. Keeping the database outside the application rollout means replacing an API image does not also replace the database it depends on. Redis remains part of the runtime stack and stores its data in a Docker volume.
The backend image is a multi-stage build. The builder uses uv with the locked Python 3.12 dependencies, and the runtime copies the prepared virtual environment into a smaller Python image. The final container runs as the unprivileged app user and starts through a small entrypoint. The API containers all use the same image; Compose selects the FastAPI application or worker command for each service.
Dash Messaging has its own image and Compose file. The UI Dockerfile installs Node dependencies, builds Next.js in standalone mode, and copies only the standalone server, static assets, and public files into the final image. That container also runs as a non-root nextjs user. The UI stack joins the same external Docker network as ezmsg and receives its API base URLs and session settings through the environment.
Releases are image releases. The ezmsg workflow runs linting, type checks, unit tests, and database-backed tests before building and pushing the backend image to GitHub Container Registry. ezmsg-ui runs its own checks and publishes its Next.js image the same way. On the Dell server, deployment means pulling the new images and bringing the Compose services back up. The source tree and build toolchain do not need to live on the production machine.
I keep the public edge separate from the application containers. Cloudflare Tunnel runs on the Dell host and opens the outbound connection to Cloudflare, so I do not have to expose the home network with router port forwarding. Public hostnames route to the Dash Messaging UI and the API containers through that tunnel. The webhook base URL points at the public API hostname, and strict Twilio signature validation remains enabled when the request reaches ezmsg.
The tunnel is also a useful boundary for the mobile app and provider callbacks. The app talks to the participant API through its public hostname, while Twilio reaches the webhook endpoint through the same controlled ingress path. The Docker network stays an internal service network; Cloudflare handles public DNS, TLS, and the connection back to the host.
Monitoring runs as a second Compose stack on the same machine. Prometheus, Grafana, Loki, Promtail, Postgres and Redis exporters, cAdvisor, node-exporter, the black-box exporter, Jaeger, and the OpenTelemetry Collector share the ezmsg network. Promtail reads Docker logs, cAdvisor reports container resource use, and the exporters make the database, Redis, and host visible beside application metrics. This keeps deployment and observability separate while still letting the dashboards follow one message across both stacks.
Portainer gives me the operational inventory at a glance. The ezmsg, ezmsg-ui, and ezmsg-obs stacks are visible separately, along with the image version and health state of each API, worker, Redis, UI, and observability container. When a dashboard reports a problem, I can first check which container changed before following the message through logs and traces.
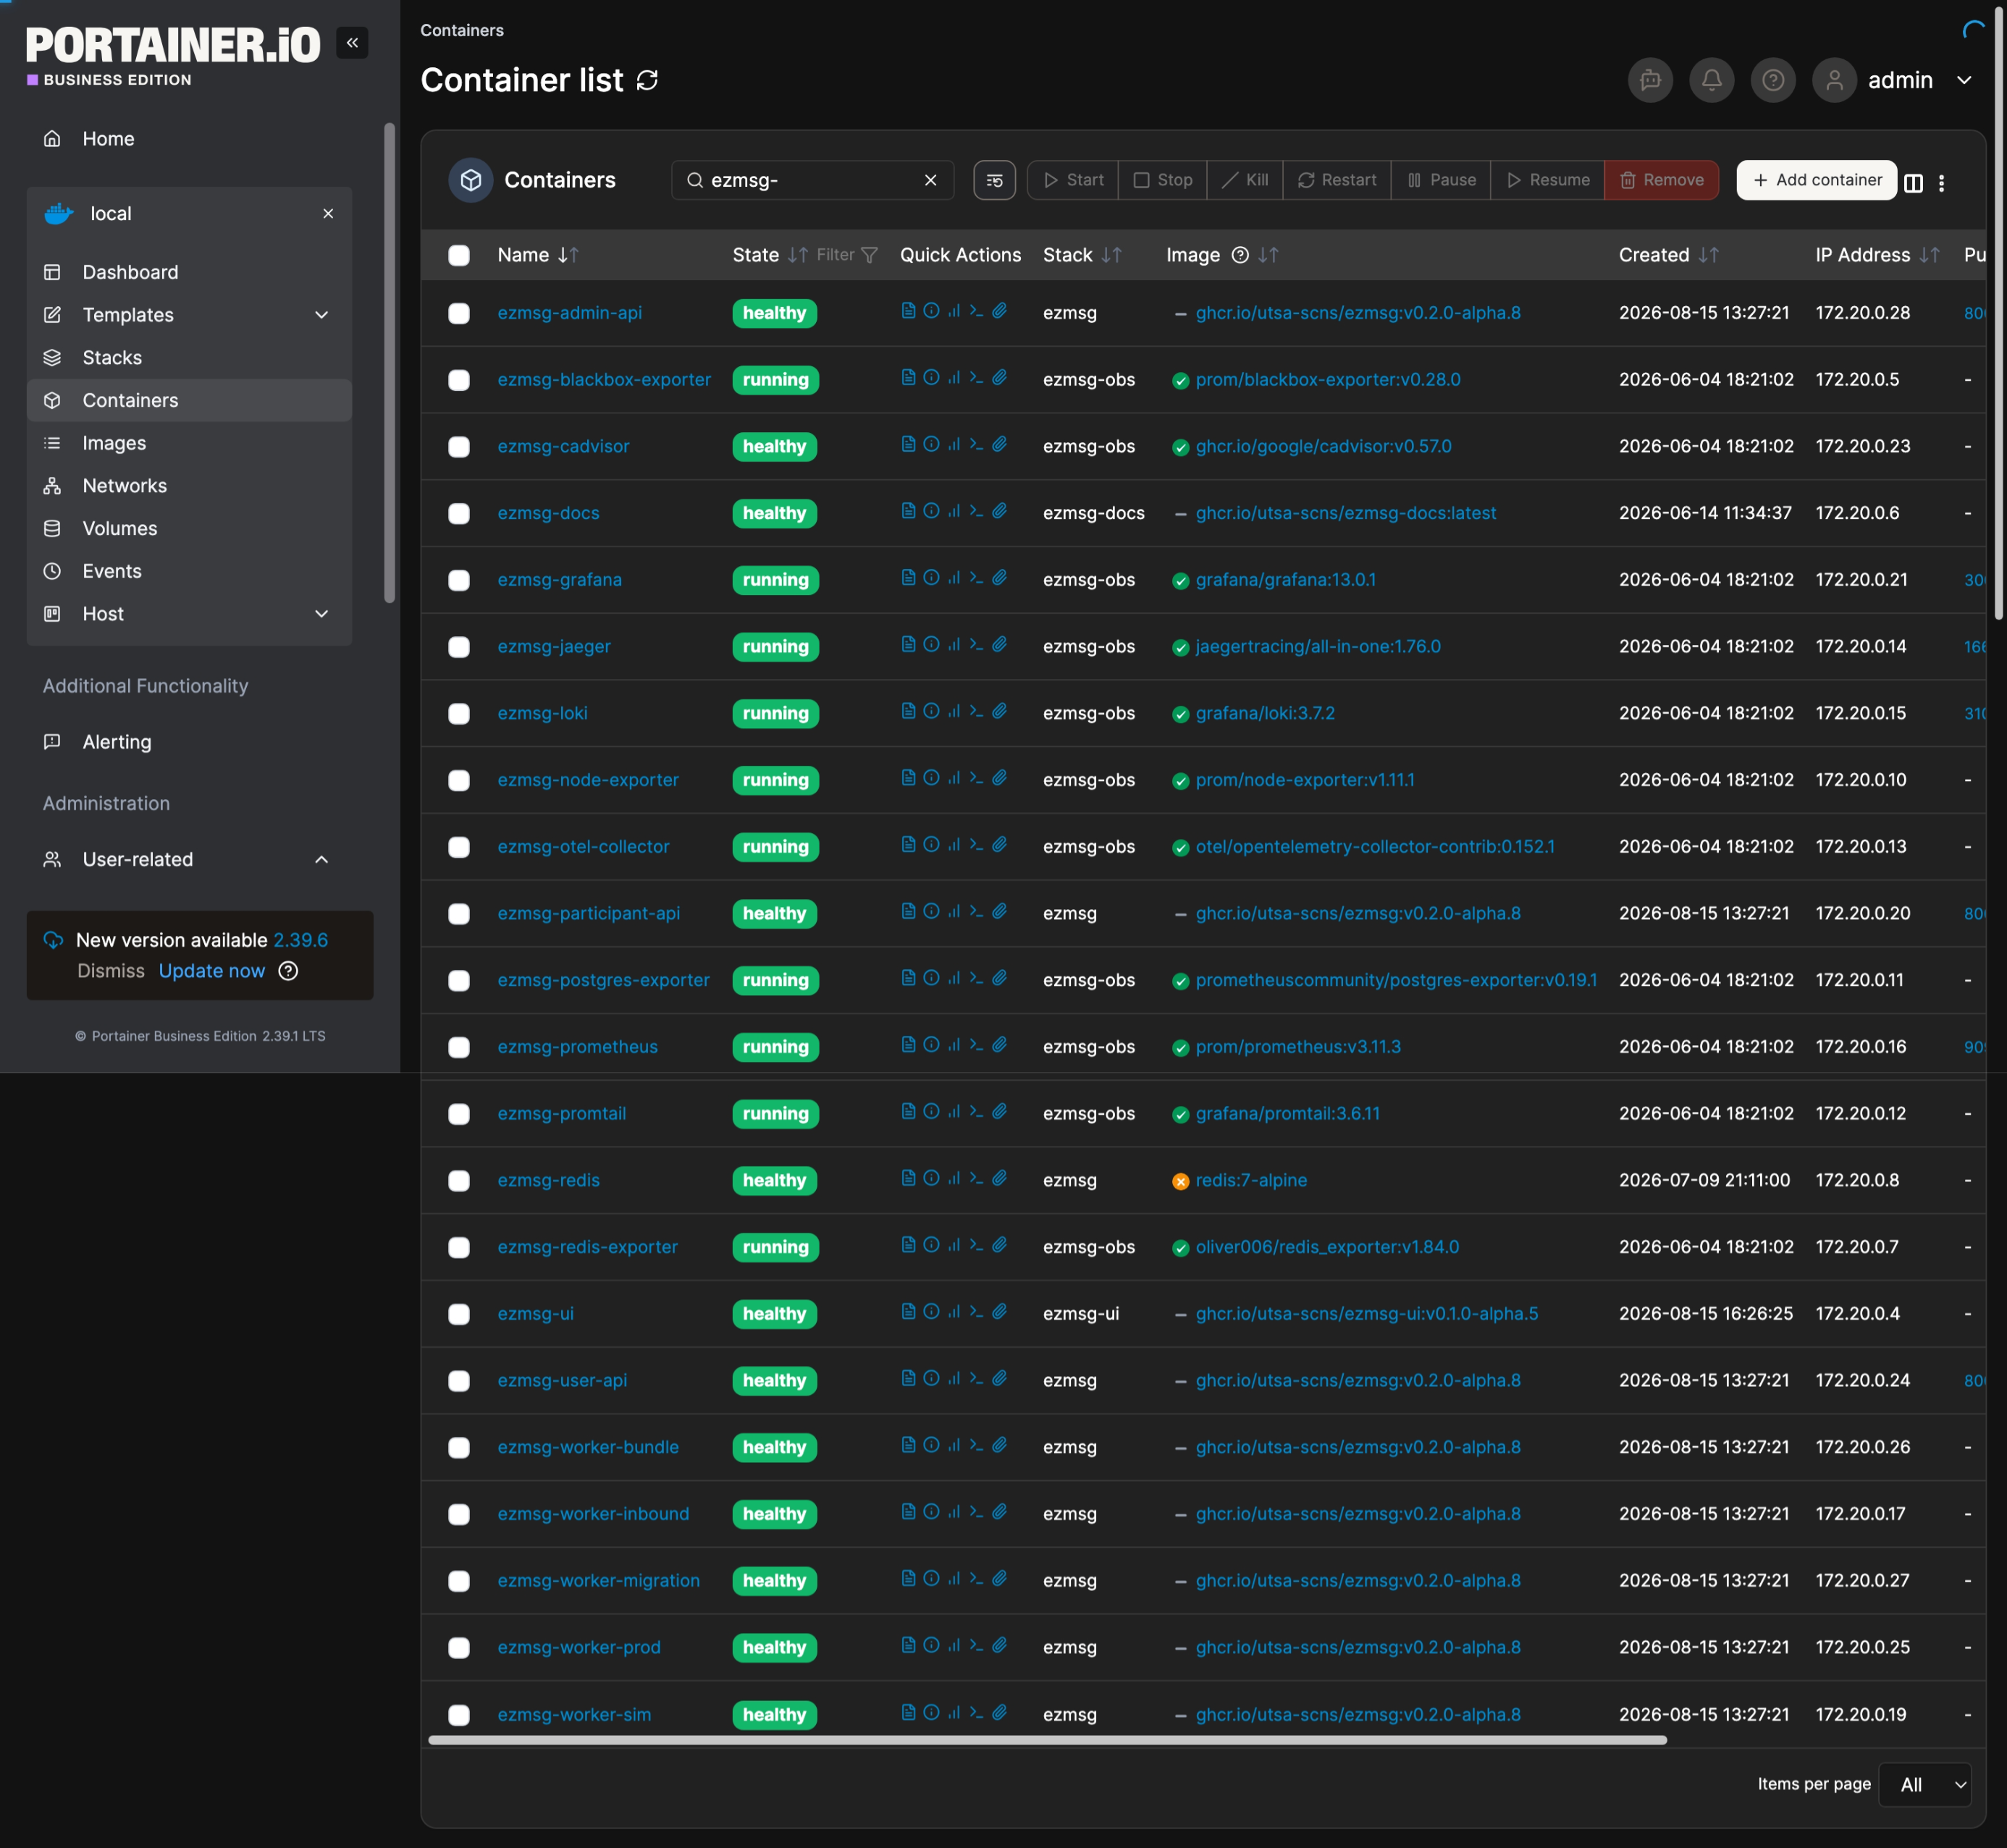
Portainer shows the container inventory and health state on the Dell server.
A home server can lose power or its internet connection, and a tunnel cannot make an offline machine available. I accepted that failure mode because the deployment is small enough for me to understand end to end. Docker restart policies bring containers back after a host restart, persistent volumes keep service state in place, and the monitoring stack tells me which part of the system came back and which part still needs attention.
Privacy had to be designed in
This is a research messaging platform, so privacy has to shape the data paths and API responses from the beginning.
The people operating a study usually need to know a participant's progress, messages, and enrollment state. They do not need every phone number or email address in the system. I separated those concerns so operators work with pseudonymous participant identities while the automated delivery path can access the destination it needs.
In ezmsg, that became an identity vault. Phone numbers, email addresses, and device tokens are stored with AES-256-GCM authenticated encryption, while an HMAC-based blind index still allows the system to find a participant without exposing the original value to routine queries. Provider credentials live in a separate encrypted store; the channel configuration keeps a reference to them rather than carrying the secret through every request.
The channel boundary verifies provider webhook signatures before accepting an event. The API has separate staff and participant access paths, and the project roles limit who can edit protocols, operate a study, or manage its channels. Logs and operational views are designed to avoid exposing message content and provider secrets by default. The API tests check that sensitive fields do not accidentally appear in ordinary operator responses.
The encryption code uses authenticated encryption with associated data, so ciphertext is tied to the identity record it belongs to and fails verification if moved to another record. Identity data and channel secrets use separate encryption domains. Production startup also rejects known development key material. These checks make accidental misconfiguration fail early, before it becomes a silent security downgrade.
There is still work to do around production key management, retention, and some operational controls. An encryption helper does not solve the whole privacy problem. I keep the boundary clear, the default views narrow, and the contract covered by tests.
How I tested the system
The highest-value tests simulate the handoffs where duplicate work, lost state, or an unsafe send could occur.
For the runtime, I test duplicate inbound events, repeated outbound completion, stale conditions, terminal-node cleanup, and the rule that a live channel cannot be advanced as if it were a simulation. For the worker path, I test outbox recovery and the difference between a provider rejection and an ambiguous provider timeout.
The bundle tests export a protocol, import it into another project, and compare the resulting definition. They also force a failure during replacement to make sure the transaction rolls back, simulate a transient database failure to verify retry behavior, and check that two jobs cannot replace the same project concurrently.
The channel tests cover SMS and MMS separately because their wire formats are not interchangeable. They check that links remain text, images become media, media-only messages are valid, and a failed media leg does not erase a successful text leg. Webhook tests cover signature validation, inbound normalization, and receipt handling.
The UI and mobile tests protect different contracts. The console tests cover token refresh, server-action error mapping, and simulation cursor reconciliation. ezmapp tests cover message-gap sync, optimistic outbox reconciliation, reconnect policy, and keeping a conversation surface alive while multiple parts of the app still use it.
I test each handoff where a plausible failure could create duplicate work, lose state, or send something unsafe.
What I learned building ezmsg
A worker crash, a provider timeout, a protocol edit, or an offline phone can all leave a conversation between states. Those cases shaped more of ezmsg than any framework choice.
Postgres records the scheduled message, transcript, receipt, and participant state. Redis moves work between workers. The outbox connects those systems while keeping the database write and network write as separate operations. Idempotency makes a repeated handoff safe.
The bundle format also changed how I think about the protocol. It is something I can review, test, export, and move between projects, while stream-event versioning can evolve separately inside the worker system.
Simulation gives the author control over time and delivery. SQLite gives the participant continuity when the network disappears. Monitoring gives me a path through the system: scheduled row, outbox, Redis, consumer, provider, and graph advancement.
A participant sees a message on a phone. Underneath it, ezmsg keeps the graph, state, delivery, and recovery paths connected well enough to explain what happened when the path breaks.