---
title: 'Building Production Observability with Splunk'
date: '2026-11-17'
lastmod: '2026-11-17'
tags: ['sre', 'devops']
images: ['/static/blog/splunk-observability-cloud-sre/1.jpeg']
summary: 'How I built a high-density observability stack on Splunk Observability Cloud: OpenTelemetry Collector architecture, custom SignalFlow metrics, centralized alert design, and SRE dashboard layouts.'
authors: ['hoangndst']
layout: 'PostLayout'
sources:
- title: 'Splunk Observability Cloud Documentation'
url: 'https://docs.splunk.com/observability/en/index.html'
- title: 'OpenTelemetry Collector Splunk Distribution'
url: 'https://github.com/signalfx/splunk-otel-collector'
- title: 'SignalFlow Streaming Analytics Language'
url: 'https://dev.splunk.com/observability/docs/signalflow/'
- title: 'Google SRE Book: Monitoring Distributed Systems'
url: 'https://sre.google/sre-book/monitoring-distributed-systems/'
---
When instrumenting the production infrastructure for `ezmsg`—a messaging and distributed worker platform running FastAPI, Redis Streams, and eight background workers—I wanted an observability setup focused on operational signal rather than dashboard decoration. On-call triage needs immediate visibility into queue lag, execution loop heartbeats, and copy-pasteable diagnostic commands.
I built the observability stack on Splunk Observability Cloud around three core design choices:
1. **High-density telemetry**: Every metric card includes historical trend lines instead of isolated numbers.
2. **Loop heartbeats**: Monitor task execution loops directly rather than relying on HTTP status checks.
3. **Decoupled runbooks**: Separate detection rules from notification templates so alert notifications always carry tested triage commands.
## The Telemetry Pipeline
The production architecture runs FastAPI backend services, eight background stream workers, Redis Streams, and PostgreSQL. Telemetry passes through a local containerized Splunk OpenTelemetry Collector before export to Splunk Observability Cloud.
### Collector Configuration
The OpenTelemetry Collector handles Prometheus scraping, memory protection, and export over TLS. Three configuration choices protect collector stability under load:
1. **Memory ballast (`memory_ballast`)**: Allocating 20% of container memory as ballast stabilizes garbage collection cycles during traffic bursts, preventing dropped samples.
2. **Memory limiter (`memory_limiter`)**: Sets a hard ceiling at 80% memory usage with a 20% spike limit. Near the ceiling, the collector sheds non-critical telemetry instead of crashing.
3. **Batching (`batch`)**: Flushes every 5 seconds or whenever 8,192 metrics accumulate, reducing network overhead to the Splunk ingest endpoint.
```yaml
# OpenTelemetry Collector Core Pipeline
receivers:
prometheus:
config:
scrape_configs:
- job_name: 'ezmsg-services'
scrape_interval: 10s
static_configs:
- targets: ['ezmsg-user-api:8000', 'ezmsg-admin-api:8000']
- job_name: 'ezmsg-workers'
scrape_interval: 10s
static_configs:
- targets:
- 'ezmsg-worker-prod:8000'
- 'ezmsg-worker-sim:8000'
- 'ezmsg-worker-ai-index:8000'
- 'ezmsg-worker-bundle:8000'
processors:
memory_ballast:
size_in_percentage: 20
memory_limiter:
check_interval: 2s
limit_percentage: 80
spike_limit_percentage: 20
batch:
send_batch_size: 8192
timeout: 5s
exporters:
signalfx:
access_token: "${SPLUNK_ACCESS_TOKEN}"
realm: "${SPLUNK_REALM}"
service:
pipelines:
metrics:
receivers: [prometheus]
processors: [memory_ballast, memory_limiter, batch]
exporters: [signalfx]
```
## Tuning Metrics in SignalFlow
Splunk Observability Cloud executes streaming computations through SignalFlow. Naive metric queries cause serious blind spots in production.
### Worker Heartbeats vs. Port Checks
A standard Prometheus scrape tracks `up{job="ezmsg-workers"}`. If a Python worker deadlocks or freezes in a processing loop while its HTTP server still returns `200 OK` on `/metrics`, standard uptime alerts stay green even though queue processing has stopped.
To capture actual worker progress, each worker emits `ezm_worker_up{worker="..."}` only after completing an iteration of its task loop. SignalFlow aggregates active workers with a live sum:
```python
A = data('ezm_worker_up').sum().publish(label='Active Workers')
```
If any worker process hangs or crashes, the sum drops below 8, triggering an alert within 15 seconds.
### Binary Byte Scaling
Displaying raw byte counts like `1,700,456` slows down incident triage by forcing mental math. In chart settings, we configure explicit binary byte scaling:
* Value Unit: `Byte`
* Unit Prefix: `Binary`
* Maximum Precision: `2`
Splunk scales the number automatically by $1024^2$, displaying `1.62 MiB` directly.
### Stream Consumer Lag and Dead Letter Queues
For streaming workloads, consumer group lag indicates processing backpressure before storage fills up or clients time out:
```python
# Peak consumer group lag across all stream partitions
A = data('ezm_redis_stream_consumer_lag').max().publish(label='Max Consumer Lag')
# 5-minute rolling rate of dead-letter queue insertions
B = data('ezm_dlq_messages_total').sum(over='5m').publish(label='DLQ Inflow')
```
Tracking peak lag across consumer groups identifies partition imbalances early, while DLQ rate monitoring flags serialization or schema errors as they occur.
## SRE Dashboard Layout
We split our Splunk Observability dashboards into two operational views: service-level application telemetry and host-level container infrastructure.
### Service Overview Dashboard
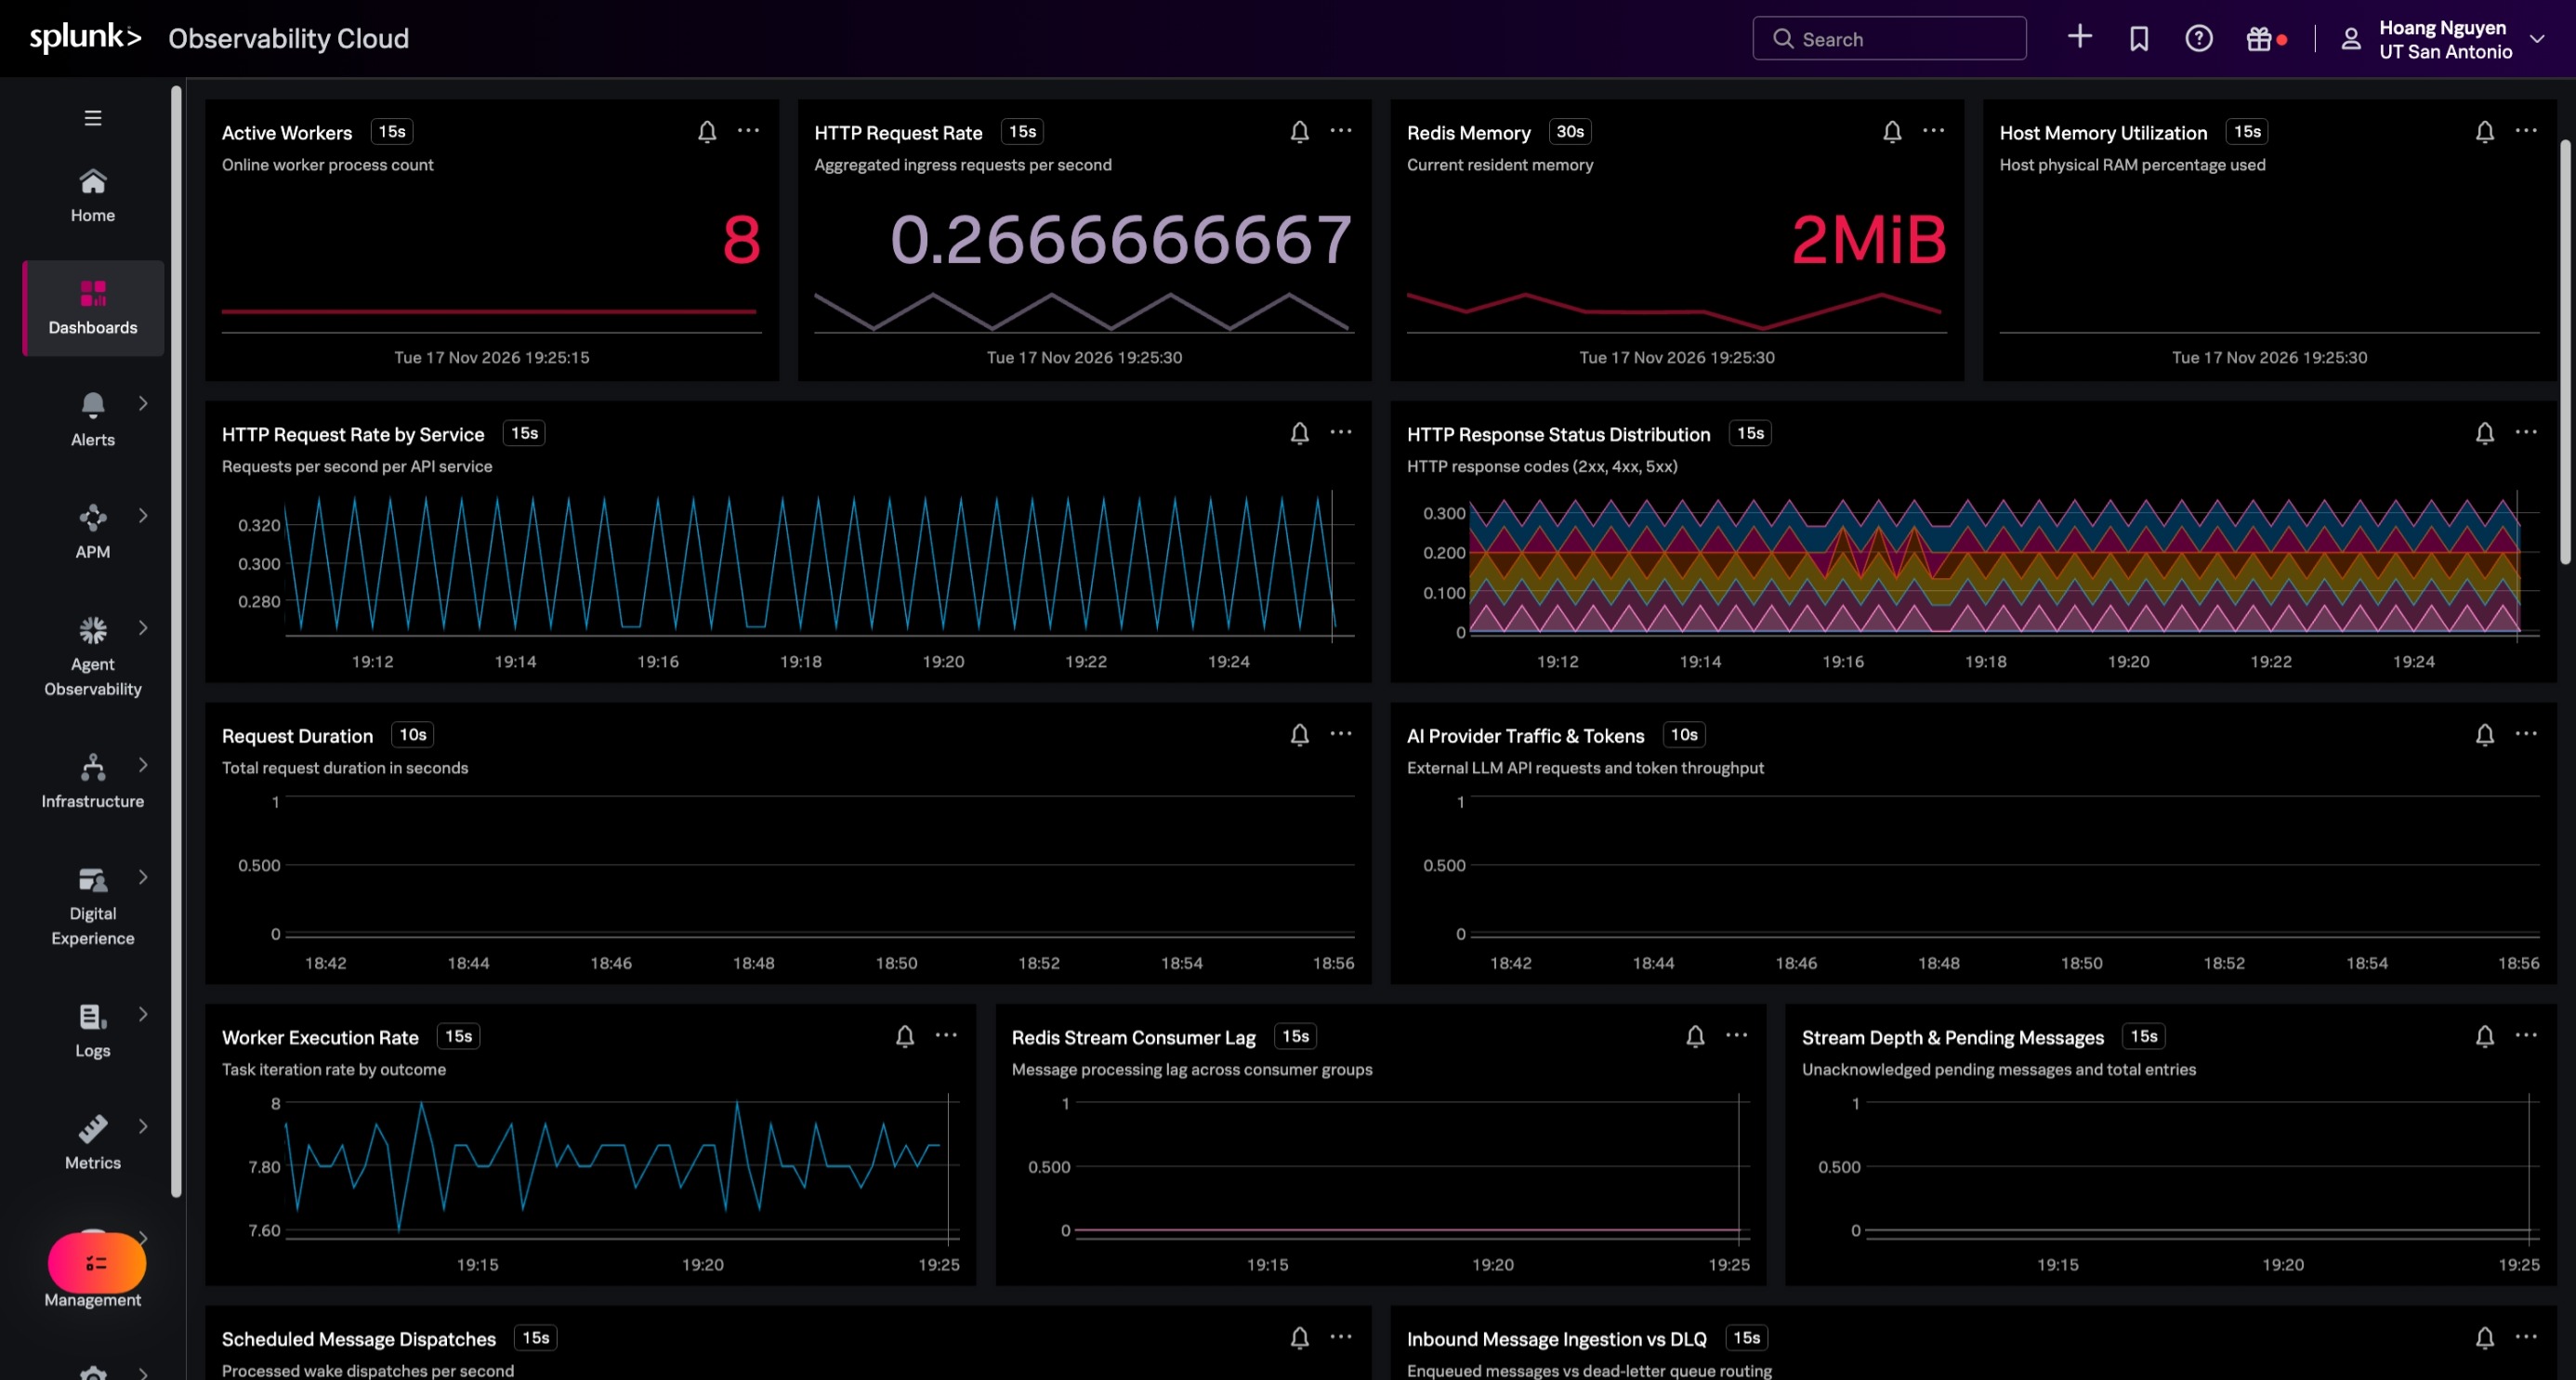
The primary SRE dashboard tracks Golden Signals, task worker throughput, and message stream buffers:
Production Service Overview Dashboard in Splunk Observability Cloud: Golden Signals, worker heartbeats, and Redis stream consumer metrics.
1. **12-Column Symmetrical Grid**: Panels follow consistent widths (`4x3` cards, `2x6` charts, `3x4` splits) so the eye can scan vertically without jagged alignments.
2. **Every Metric Card Has a Sparkline**: A bare number like `1.62 MiB` offers no indication of direction. A 1-hour rolling sparkline embedded inside each card gives immediate historical context.
3. **Three-Tier Visual Hierarchy**:
- Row 1: Golden Signals (Active Workers, Inbound Request Rate, Redis Resident Memory, Host RAM Utilization).
- Row 2: API Traffic (Request rate by service, HTTP status distribution, request duration, AI provider token throughput).
- Row 3: Pipeline & Storage (Worker execution rates, consumer group lag, stream depth, pending message counts, DLQ routing).
4. **SLO-Aligned Color Scales**:
- Green: Nominal operation ($< 1\%$ 5xx errors, $< 75\%$ RAM).
- Yellow: Warning threshold ($1\% - 5\%$ 5xx errors, $75\% - 85\%$ RAM).
- Red: Breach threshold ($> 5\%$ 5xx errors, $> 85\%$ RAM, worker count $< 8$).
### Host and Container Infrastructure Dashboard
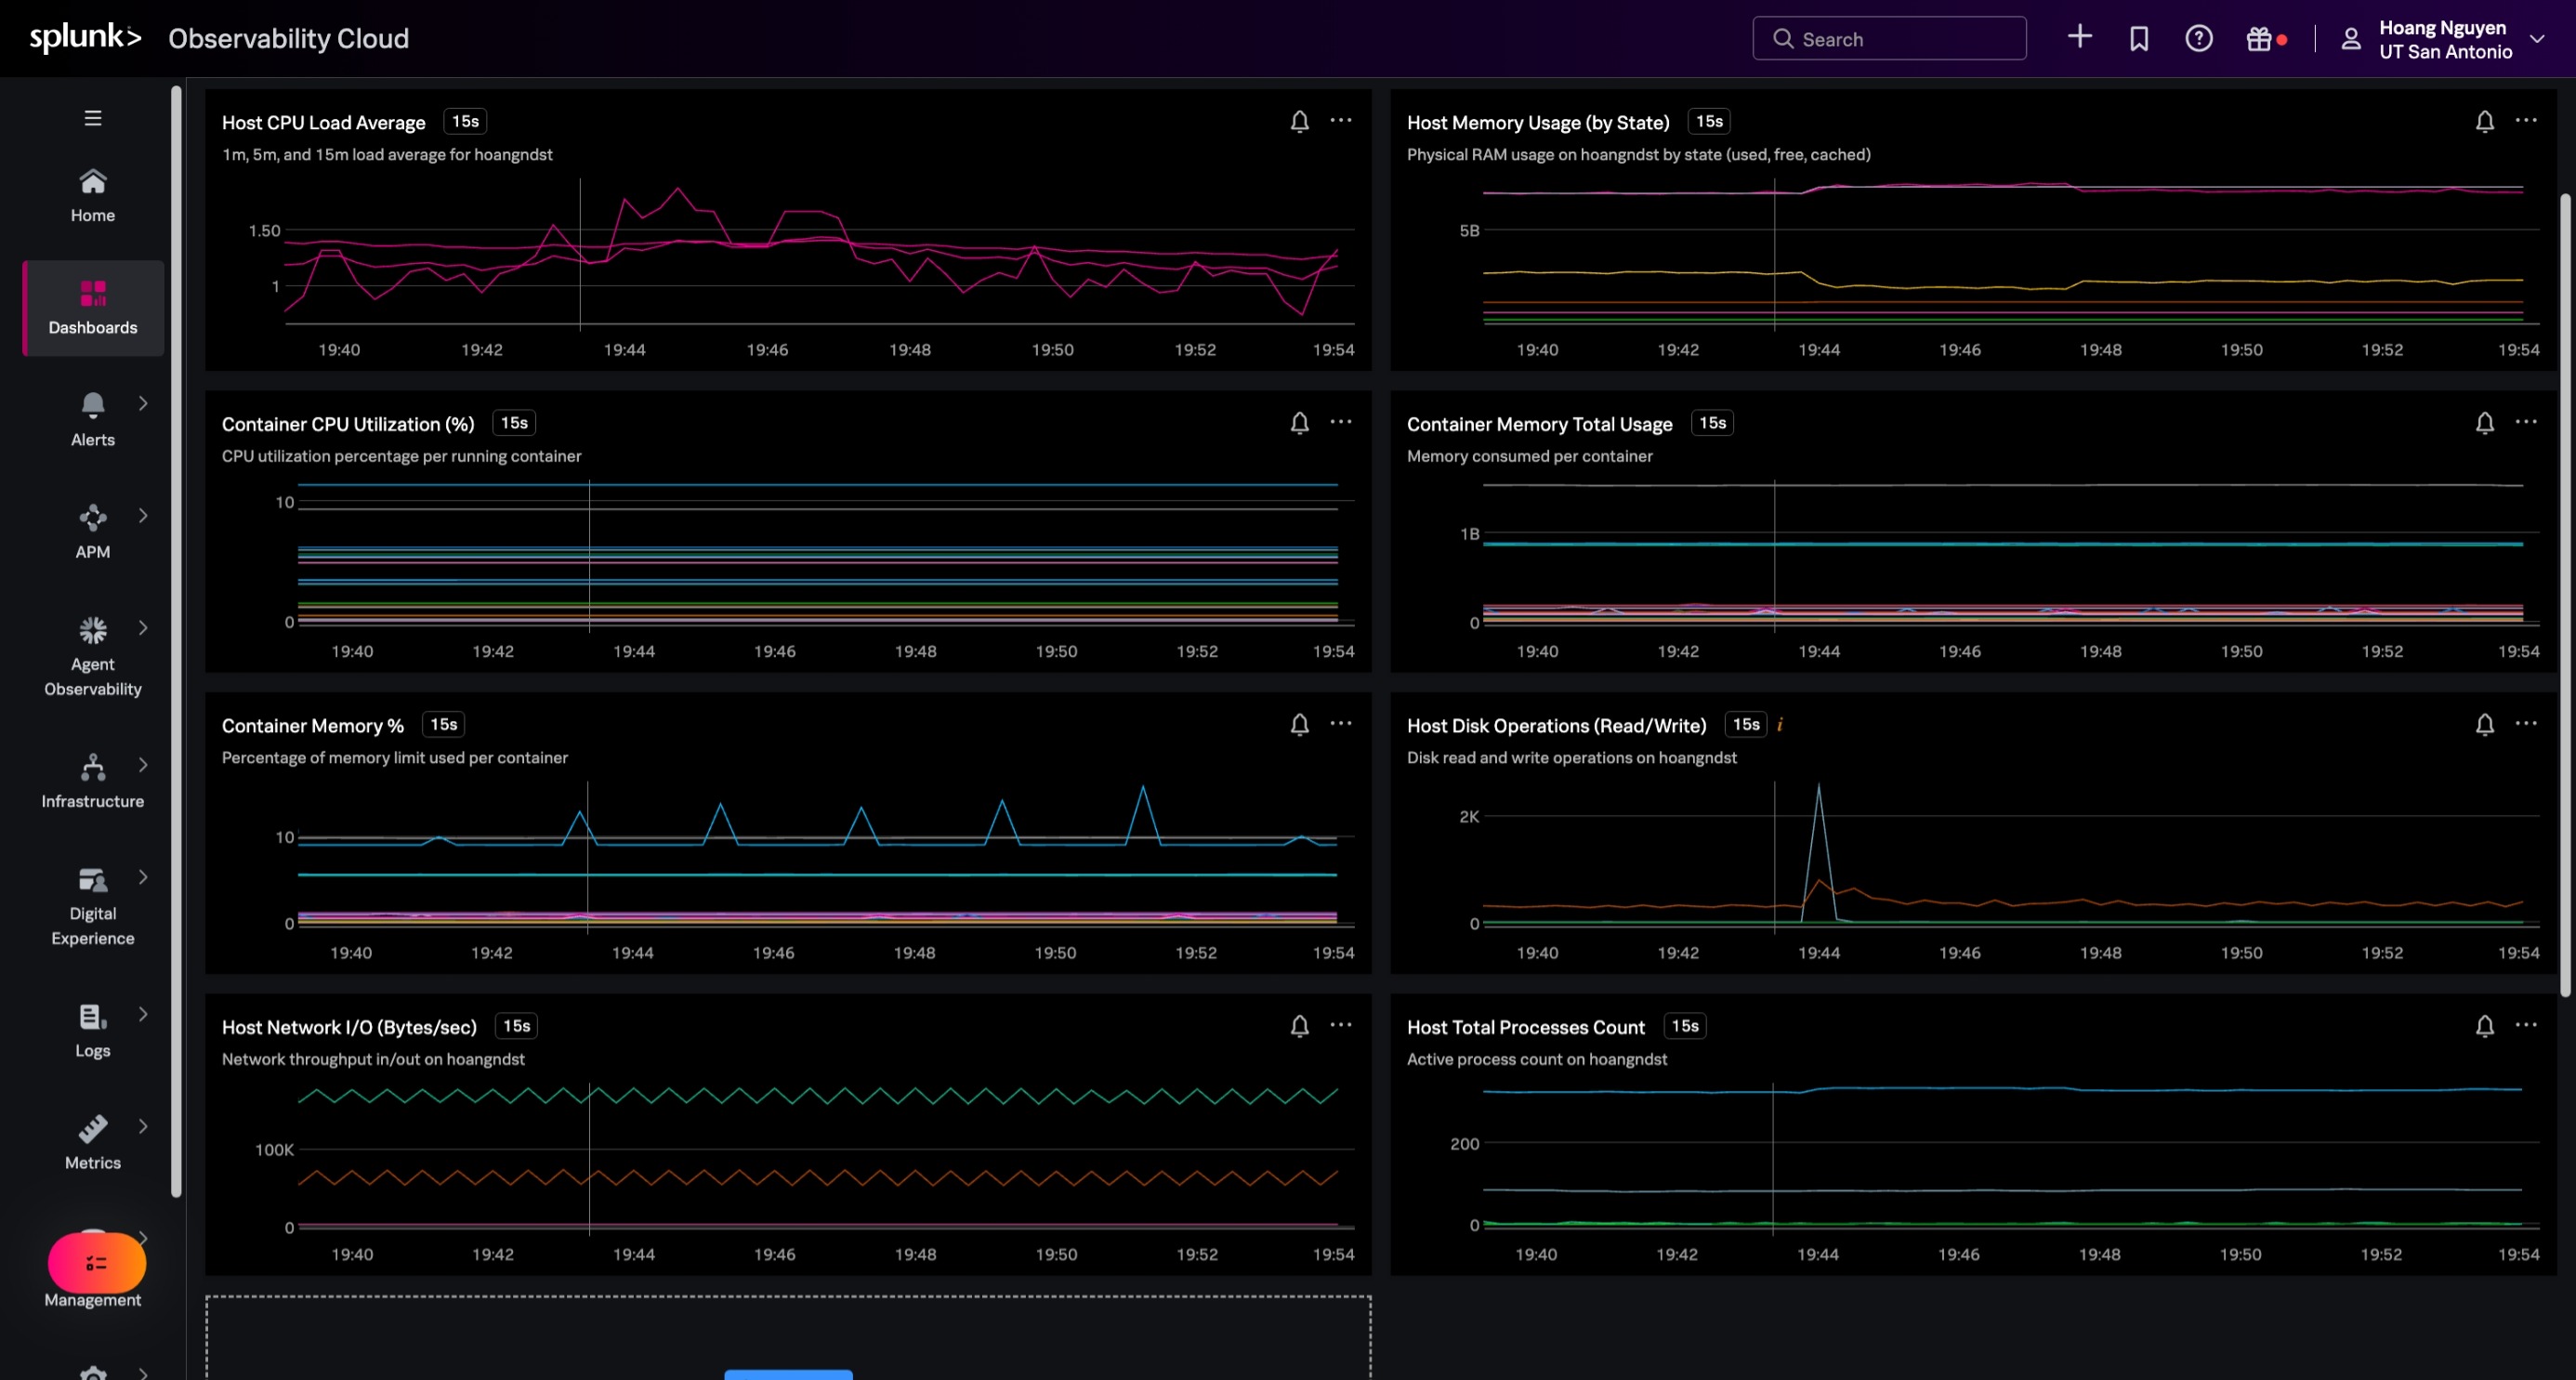
Below application metrics, a dedicated infrastructure dashboard monitors node health and container resource consumption across host `hoangndst`:
Host and Container Infrastructure Dashboard in Splunk Observability Cloud: CPU load averages, memory by state, container utilization, disk I/O, and network throughput for host hoangndst.
- **Host Load and Memory**: Tracks 1m, 5m, and 15m load averages alongside RAM state breakdown (used, free, and cached memory).
- **Per-Container Allocation**: Graphs CPU percentage and memory ceiling usage per container, identifying runaway worker processes before the kernel kills them.
- **I/O and Network Telemetry**: Monitors read/write disk operations and bidirectional network throughput to catch storage bottlenecks and socket exhaustion.
## Decoupling Alert Rules from Runbooks
Embedding notification copy, recipient emails, and shell commands inside individual detector rules leads to drift. When on-call rotations shift or diagnostic commands change, updating dozens of detectors by hand is error-prone. Runbooks fall behind, and alert emails lose useful triage context.
### Designing the Centralized Template
To keep runbooks uniform, we separated detector logic from notification formatting using a centralized SRE email template.
The template uses Handlebars expressions to inject runtime context dynamically:
```text
Subject:
{{#if anomalous}}[{{ruleSeverity}}] {{detectorName}}{{else}}[RESOLVED] {{detectorName}}{{/if}}
Body Structure:
- Detector Name and Severity
- Firing Status (FIRING vs. RESOLVED)
- Trigger Metric Value and Breached Threshold
- Timestamp and Affected Host Dimension
- Direct Link to the Production Dashboard
Diagnostic Runbook:
1. Check active containers: docker ps
2. Inspect worker logs: docker logs --tail 100 ezmsg-worker-prod
3. Check host memory: free -h
```
### Template Constraints
Two structural details matter when managing templates in Splunk Observability Cloud:
- **Handlebars syntax clashes**: Splunk evaluates template strings with Handlebars. If a shell command in a runbook includes double curly braces (such as `docker stats --format "{{.Name}}"`), the parser treats them as unclosed template tags and rejects the payload. Diagnostic runbook commands must avoid raw double braces.
- **Centralized detector binding**: Detectors attach to templates by referencing the template identifier (`templateId`) in their notification rules. Updating runbook steps or escalation contacts in the centralized template updates notification behavior across all linked detectors immediately.
## Production Detector Fleet
We configured six core detectors protecting our streaming infrastructure, each linked to the centralized notification template:
| Detector Name | SignalFlow Trigger Condition | Severity | Action Triggered |
| :--- | :--- | :--- | :--- |
| **Redis Memory Spike & Leak Guard** | `data('redis_memory_used_bytes') > 500 MB` | `Critical` | Triage Redis key eviction and client buffers |
| **Redis Stream Consumer Lag** | `data('ezm_redis_stream_consumer_lag').max() > 100` for 2m | `Major` | Scale worker consumers or investigate consumer deadlocks |
| **Dead Letter Queue Activity** | `data('ezm_dlq_messages_total').sum(over='1m') > 0` | `Critical` | Inspect malformed payload schema in DLQ storage |
| **Host High Memory Usage** | `(data('memory.used') / data('memory.total')) * 100 > 85%` for 5m | `Major` | Check container memory growth and system swap |
| **Worker Service Down** | `data('ezm_worker_up').sum() < 8` for 1m | `Critical` | Restart failed worker container |
| **API High 5xx Error Rate** | `(5xx_requests / total_requests) * 100 > 5%` for 3m | `Critical` | Inspect API trace spans and database connection pools |
## Engineering Takeaways
1. **Emit loop heartbeats over HTTP pings**: A passing HTTP check only verifies the web server process is responsive. Track the loop that actually drains and processes queue items.
2. **Format units at the chart layer**: Avoid raw byte counts that require calculation during incidents. Set binary scaling and precision in chart definitions.
3. **Decouple detector logic from runbooks**: Managing notification templates centrally prevents operational drift and ensures alerts deliver consistent diagnostic steps.